

Four Decades of
Innovation & Growth


YEARS
PIONEERING INNOVATION,
SUSTAINABLE GROWTH
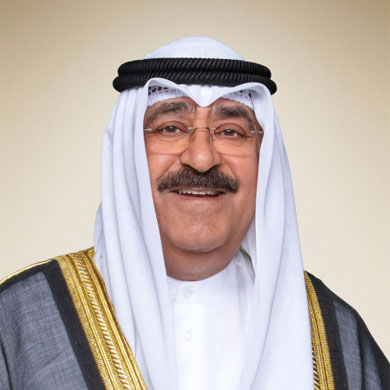
Sheikh Meshal Al-Ahmad Al-Jaber Al-Sabah
His Highness The Amir of Kuwait
A 25-YEAR YOUNG COMPANY WITH UNBEATABLE SCALE
Financial Performance
REVENUE
$ 0 BILLION
(KD 1.9 BILLION, +10% YOY)
EBITDA
$ 0 BILLION
(KD 705 MILLION, +5% YOY)
EBITDA MARGIN 37%
NET INCOME
$ 0 MILLION
(KD 215 MILLION, +10% YOY)
CAPEX
$ 0 MILLION
(16% of Revenue)

51 MILLION
ACTIVE CUSTOMERS

$2.4 BILLION
DATA REVENUE REPRESENTING 39% OF GROUP REVENUE

30.4 Petabyte
AVERAGE DAILY DATA VOLUME

50 FILS
IN EPS (16 CENTS)

1.9x
IN NET DEBT/EBITDA

Market Leader
IN KUWAIT, IRAQ, SUDAN & JORDAN

5G
TECHNOLOGY
IN KUWAIT, KSA, BAHRAIN & JORDAN

7,900+
EMPLOYEES

66
NATIONALITIES

27%
FEMALE EMPLOYEES
KEY PERFORMANCE HIGHLIGHTS
-

A-
Leadership Position
50/100
Above Industry Average
-

BB
Within Industry Average

4/5
Above Industry Average
Board of Directors Statement
On behalf of my fellow members of the Board of Directors, I am pleased to welcome you to the annual General Assembly, in which we review Zain Group’s operations and the results of its subsidiaries for the financial year ended December 31, 2023.
Technological transformations have added to the richness of the evolving landscape, with increasing reliance on digital solutions, automation, and the capabilities of artificial intelligence (AI). These transformations have imposed a new reality on governments, large enterprises, and small and medium-sized companies in terms of their ability to build competitive businesses.
Digital technologies have made societies more interconnected and enhanced the quality of life of people, and the importance of digitization has become apparent as a driver of socio-economic growth. Digital transformation initiatives have changed the way governments and businesses are organized and managed, with 5G applications, cloud services, big data, AI, data analytics, machine learning, Internet of Things, blockchain, managed services, and cybersecurity becoming the main change drivers for the foreseeable future.
As information and communications technologies bolster the prosperity of societies and businesses, telecommunications companies need to be agile in keeping abreast with the latest technologies as well as providing state-of-the-art infrastructure, in order to drive revenues and provide customers with a superior mobile and data experience.

Strategic partnerships driving value
Recently, in addition to heavy investment in networks and technologies, Zain Group has entered multiple strategic partnerships with global and regional institutions to ensure that its transformational initiatives closely respond to market needs. These alliances have helped increase the value of Zain’s core business, and support the focus on new lucrative growth opportunities in the digital sector and beyond.
The Group’s operations are spread across markets where the pace of investment in major projects and infrastructure is increasing. These markets have an attractive operational landscape driven by digital transformation and the adoption of technological solutions and innovations. This promising environment is expected to provide further growth opportunities for Zain Group operations.
Over recent years, the Group has gained a solid reputation for rewarding its investors, as it has demonstrated its commitment to providing shareholders with regular dividends through its commitment to a fixed dividend amount for three years, despite the post-pandemic economic slowdown, geopolitical challenges, and economic, social and security developments.
Growth in key financial KPIs
Despite the difficult circumstances represented by geopolitical instability in the region, and the challenges associated with some economic and social conditions, the progress of the company’s 4Sight strategy resulted in developing new value accretive entities and driving operational efficiency, as the Group’s operations recorded strong growth in 2023.
Zain operates in a highly regulated, competitive, and rapidly evolving environment, achieving one of the highest returns on investment in the region, further supported by a series of recent acquisitions that have given the company greater impetus to diversifying revenue sources.
For the full-year 2023, Zain Group generated consolidated revenue of KD 1.9 billion (USD 6.2 billion), a year-on-year (Y-o-Y) increase of 10%. Consolidated EBITDA for the period increased by 5% Y-o-Y to reach KD 705 million (USD 2.3 billion), reflecting an EBITDA margin of 37%. Consolidated net income reached KD 215 million (USD 701 million), up 10% Y-o-Y, and reflecting earnings per share of 50 fils (USD 0.16).
The Group’s customer base recorded 50.6 million active customers, a number that was negatively affected by the recent civil unrest taking place in Sudan.
The growth of financial indicators was driven by strong operational performances, especially in Kuwait, KSA, Iraq, Jordan, and Sudan, as Zain KSA recorded the highest revenue and net profit in its history, while in Iraq the performance was strong. In Sudan, Zain performed extremely well despite the difficulties in the face of the current social instability , which we hope will subside during 2024.
The achievement of these impressive Group results is also due to the growth of data services, developments in the B2B enterprise sector, significant increase in revenues from fintech, and substantial gains from the sale and leaseback of towers for operations in Iraq and KSA. Net profits in 2023 were also boosted by the successful conclusion of the number range lawsuit in Kuwait.
Board recommendations for 2023
The Board of Directors of Zain Group recommended a cash dividend of 25 fils per share for the second-half of 2023.This dividend follows the semi-annual dividend of 10 fils distributed earlier in 2023, totaling 35 fils per share for the year, and reflecting a 70% payout ratio, one of the highest among listed entities in the region and in line with the Board’s previously committed minimum cash dividend policy of 35 fils annually in total, for three years commencing 2023.
The Board also recommended the distribution of Directors’ remuneration totaling KD 478,500 for the financial year-ended December 31, 2023. Both recommendations are subject to the Annual General Assembly and statutory approvals.
Investment and leadership
The financial results showed growth that exceeded expectations as the Group succeeded in implementing a series of initiatives and new services enhancing the customer experience with a focus on customer care.
During the year, the Group continued its strategic investments in 4G networks, expansion of 5G infrastructure, development of fiber technology to the home, and the strengthening of digital platforms. CAPEX during 2023 reached USD 994 million (USD 837 million tangible, and USD 157 million intangible), representing 16% of revenues.
This CAPEX investment has contributed to improving customer retention and attracting new customer segments, as Zain has strengthened its leadership in the quality and availability of its networks, with the expansion of 5G services to Jordan. Zain Group now operates the largest 5G network in the region, provided in four markets – Kuwait, Saudi Arabia (KSA), Bahrain, and Jordan.
Growth drivers
Continuing efforts to enhance value, the pioneering collaboration with Qatar’s Ooredoo Group to establish the largest tower company in the Middle East and Africa, incorporating 30,000 communication towers with an estimated enterprise value of USD 2.2 billion, is well on track.
Fintech is an area that we are fostering given the lucrative nature of the business. Zain Group plans to increase the percentage that fintech services contribute to revenues over the next three years to 10%. This goal is reinforced by the successful launch of the unified brand, Bede, for micro-financing services in Bahrain, which will be rolled out across other markets within our footprint.
Enterprise and Wholesale
Our focus on the enterprise sector if paying off as ZainTECH in coordination with B2B operation teams achieved significant growth rates during the year, driven organically and by a number of key strategic acquisitions and new corporate clients. Zain Group is confident that these acquisitions will further boost ZainTECH’s position across its footprint, turning it into a leading regional digital services provider.
Zain Omantel International (ZOI) is making great strides in the wholesale carrier arena as it provides services to international operators, data centers, large enterprises, and content and cloud service providers. ZOI has succeeded in creating a unique PAN network bolstered by its investment in submarine cables through the AFRICA ONE, PEACE, and Blue Raman cables, and having established a fiber network of more than 7,000 kilometers linking KSA to neighboring countries.
Sustainability
Zain Group has demonstrated a strong commitment to environmental, social and economic development, as it has integrated its ESG indicators at a time when the challenges of climate change are increasing. As such, the Group continues to work towards achieving its ambition to achieve net zero emissions, having maintained the classification in the category Leadership at level A- in the Global Carbon Disclosure Project (CDP) report. An example of Zain’s green credentials is the development of Zain KSA and Red Sea International Company in launching the first carbon-free 5G network in the world, which operates 100% on renewable energy.
Diversity, Equity, and Inclusion
Zain Group continues to embrace diversity, equity, and inclusion (DEI) initiatives, and work to stimulate a culture of creativity and innovation, as it launched the DEI University in cooperation with Spain’s IE University to graduate over 2,000 of our talented people in digital transformation.
The Group won awards in Sustainability, DEI, and women’s empowerment during the year. Moreover, Zain was ranked among the top five global telecom companies and 21st across all sectors amongst nearly 3,000 of the largest global companies in the annual Global Child Forum’s The State of Children’s Rights and Business 2023.
Governance
Zain Group is committed to implementing a sound framework model for corporate governance, with an emphasis on enhancing the comprehensive governance environment. In this context, Zain was crowned World Finance’s ‘Best Corporate Governance’ recipient 2023 for Kuwait for the third consecutive year. Zain was also credited with providing the ‘Best Corporate Governance of a listed company in Kuwait’ in 2023 at the Arab Federation of Capital Markets (AFCM) Annual Conference.
Zain Group’s environmental, social, and corporate governance (ESG) practices are consistently rated above average by all three major rating agencies: S&P, MSCI, and FTSE. ESG practices are critical to stakeholders as they reflect the Group’s commitment to sustainability, and long-term, responsible management.
Conclusion
On behalf of all members of the Board of Directors, executive management, and employees of Zain, we express our sincere appreciation for the confidence shown in us by our valued customers and shareholders, as well as by all the government ministries, and regulatory authorities across our markets.
We would like to offer our deepest gratitude and appreciation to His Highness the Amir of Kuwait, Sheikh Meshal Al-Ahmad Al-Jaber Al-Sabah, and to the esteemed members of the government for their continued support of Kuwait’s national organizations.
YEAR IN REVIEW
-
JANUARY

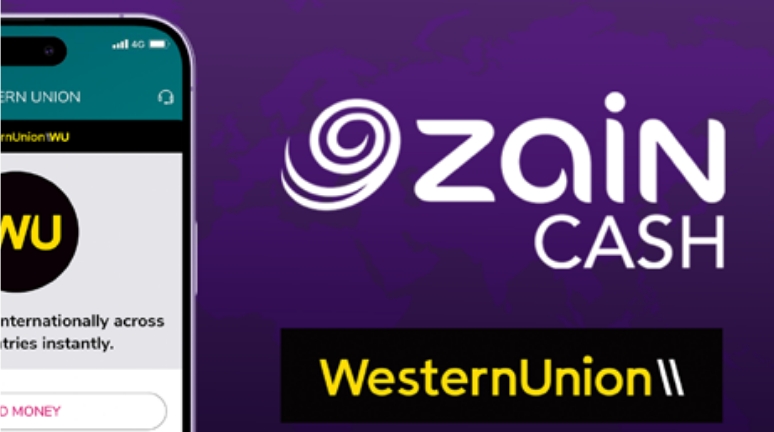
ZainCash Iraq collaborates with Western Union to enable digital cross-border money transfers.
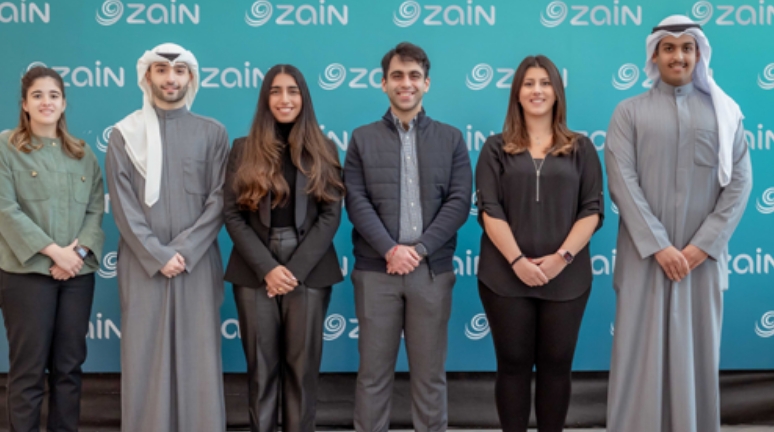
Zain ‘Generation Z’ 2023 program welcomes six high caliber Kuwaiti graduates.
Zain Iraq finalizes the sale and leaseback of 4,968 towers to TASC Towers Iraq
Zain title sponsor of ‘Khaleeji Zain 25’- Arab Gulf Cup silver jubilee in Basra, Iraq.
-
FEBRUARY
Zain Kuwait, ZainTech, and Microsoft collaborate to launch the National Cloud Initiative, empowering organizations in the country.
ZainTech completes acquisition of BIOS Middle East and expands managed cloud offerings.
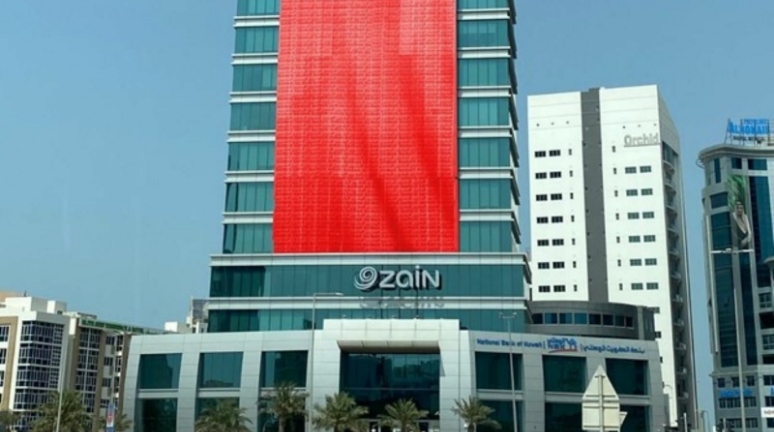
Zain Bahrain launches a first in market Omnichannel engagement platform delivering a seamless customer experience and service, with a faster and more consistent level of support.
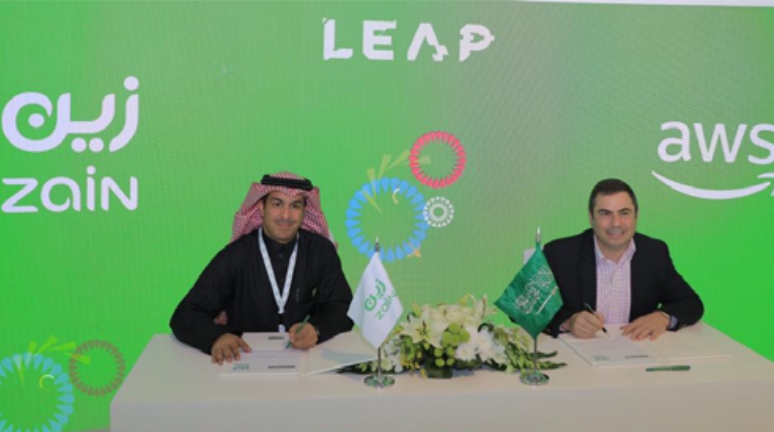
Zain KSA’s participation in the Kingdom’s distinguished global tech event ‘LEAP’ witnesses’ multiple groundbreaking agreements with Google, AWS, Emaar, AST SpaceMobile and more.
-
MARCH

Zain Iraq hosts 9 esports tournaments with 3,000 players from all over Iraq including a tournament for people with disabilities for the first time in Iraq.

Zain Great Idea recognized as ‘Ecosystem Enabler of the Year’ for accelerating the Kuwait and regional tech startup ecosystem at Entrepreneur ME magazine’s E-Business Awards.
-
APRIL

Zain publishes its 12th annual sustainability report, entitled ‘An Inclusive Transition for Future Generations’.

Zain successfully completes trial for 5.5G IoT RedCap Technologies in Kuwait.
-
MAY
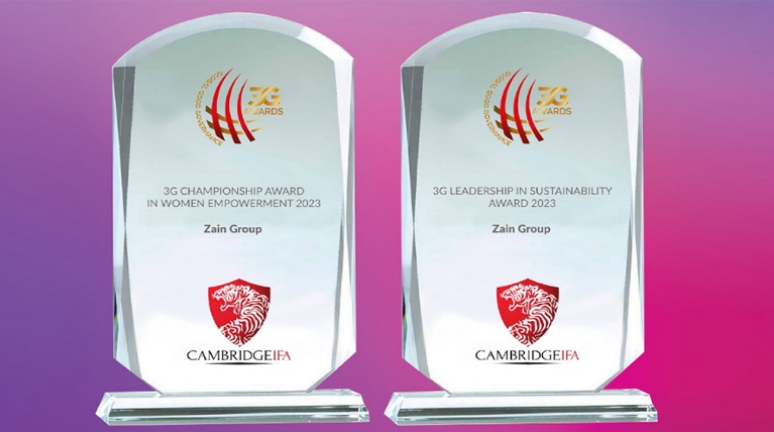
Zain wins two distinguished awards in Sustainability and Women’s Empowerment.
Unveiling of ‘Zain Omantel International’ (ZOI) to revolutionize the telecommunications landscape.

ZainTech acquires Adfolks, expanding digital transformation services.

Zain maintains leadership position of A- in ‘CDP Score Report– Climate Change 2022′ and attains A- score on the Supplier Engagement rating.
-
JUNE
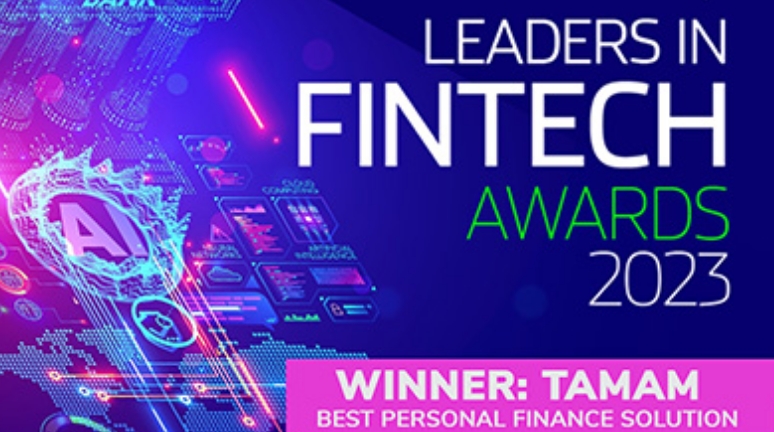
Zain’s “Tamam” platform in Saudi Arabia awarded ‘Best Personal Finance Solution’ in Middle East.
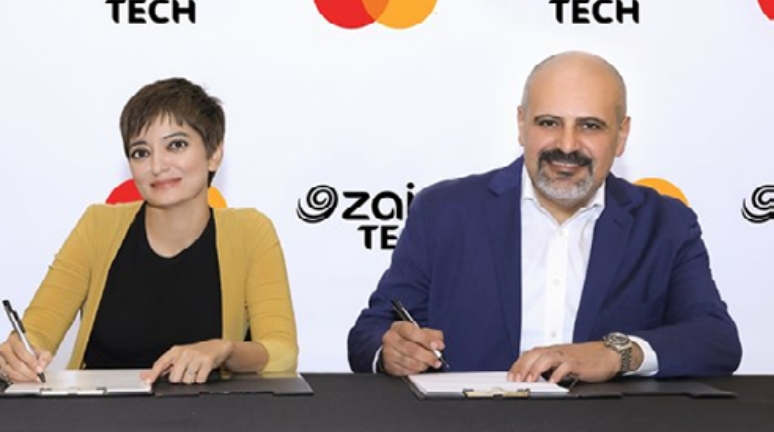
ZainTech partners with Mastercard to provide unique AI and Machine Learning data solutions to businesses.

A regional first: Embracing a disability inclusive environment for all, Zain’s operation in Jordan provides mobile phone subscriptions in sign language.
-
JULY
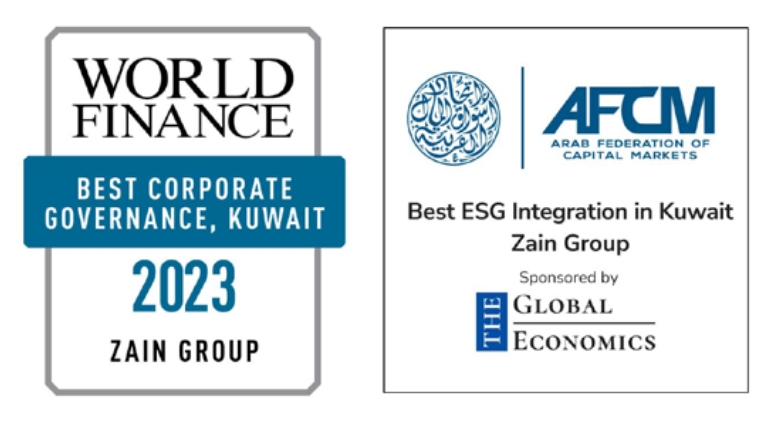
Zain wins two ‘Best Corporate Governance in Kuwait’ awards from World Finance and the Arab Federation of Capital Markets.

Zain Sudan only operator to continue providing connectivity during social conflict challenges focusing on introducing digital payment channels, expanding shops, POS locations, establishing contact centers in non-war zone cities, and increasing remote agents along with introducing favorable data roaming packages, reinforcing connectivity solutions and community commitment, along with free access to WhatsApp and Facebook. Also, maintenance team heroes offered great efforts combating significant fiber cut incidents in a hazardous area, risking their lives to ensure proper service levels to our customers.
-
AUGUST
Jordan’s Zain Innovation Campus (ZINC) celebrates its milestone of holding 5,900 events with over 350,000 visitors across its eight branches covering entrepreneurship, artificial intelligence (AI), digital marketing, robotics, and Internet of Things (IoT). To date, ZINC has supported 242 startups including the sixth edition of Zain Al Mubadarah program, involving over 30 startups.
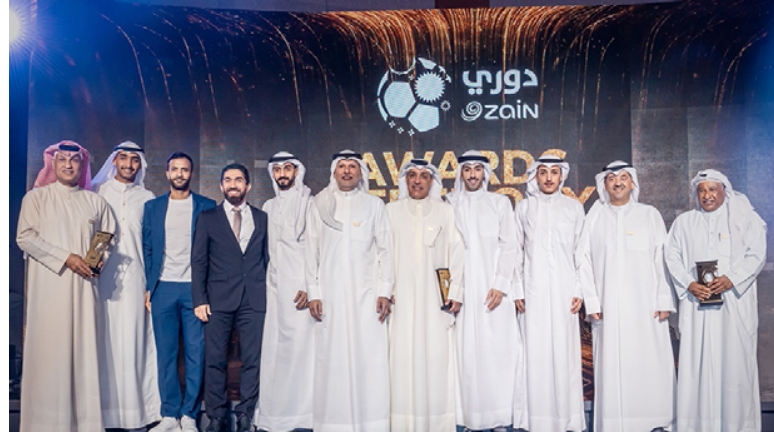
Zain Kuwait kicks-off it 2023/2024 sponsorship of the 62nd season Kuwait Premier League (Dawri Zain) in partnership with the Kuwait Football Association.
-
SEPTEMBER
Zain Kuwait unveils marketing partnership with Red Bull Mobile offering all-new prepaid plans.

Red Sea Global and Zain KSA unveil revolutionary net-zero 5G network at flagship destination, The Red Sea.
-
OCTOBER
ZainTECH’s inaugural participation at GITEX Global 2023 a resounding success.
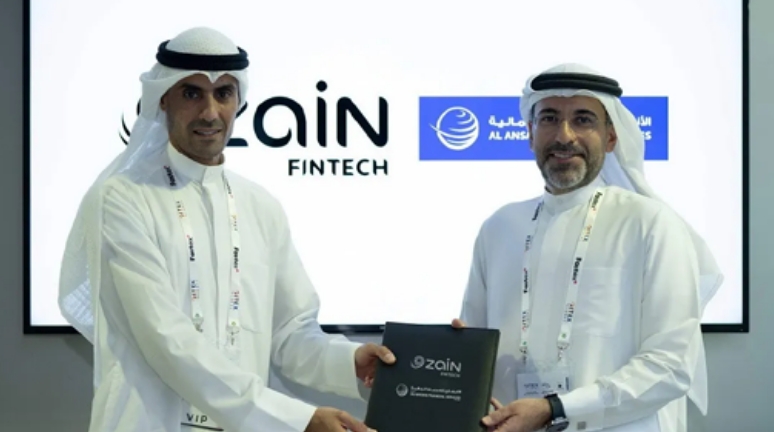
Zain FinTech and Al Ansari Financial Services partnership aims to revolutionize the region’s financial landscape.
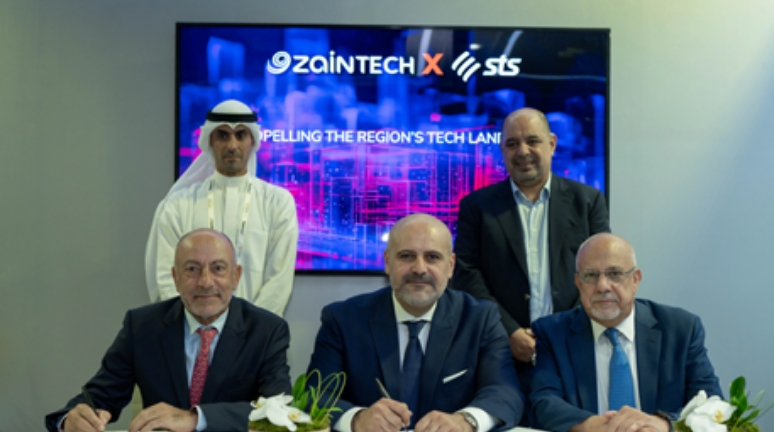
ZainTECH agreement to acquire STS, a leading digital transformation solutions provider.
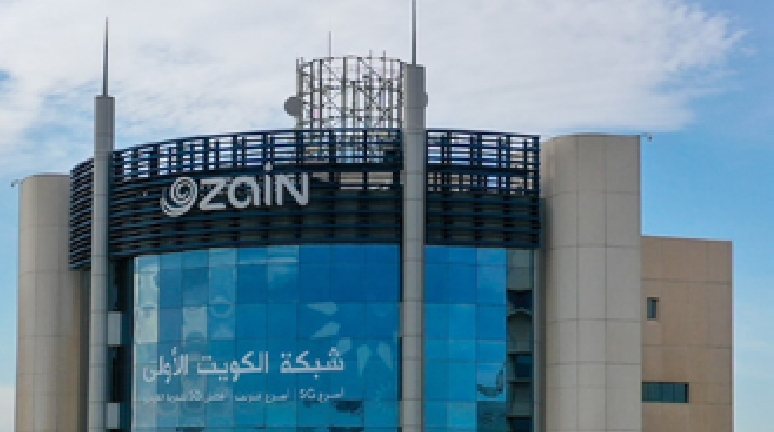
Zain Kuwait wins ‘Outstanding 5G Business Development’ award from SAMENA Council.
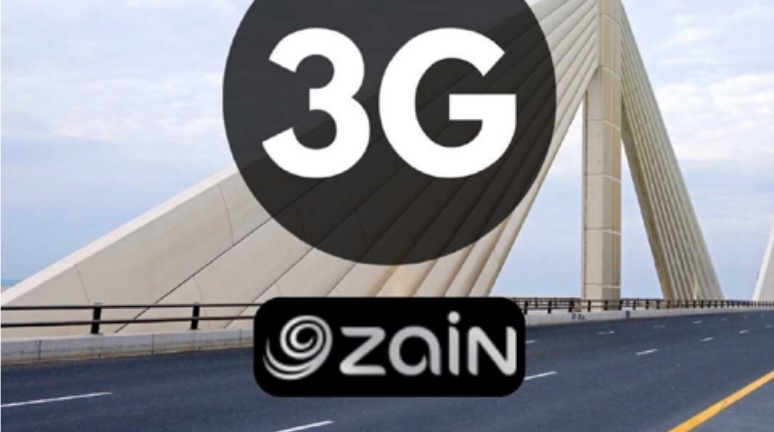
Zain Bahrain sunsetted its 3G network thus improving 4G and 5G experience with superior speeds, marking the operator as the first in the region to make this strategic move.
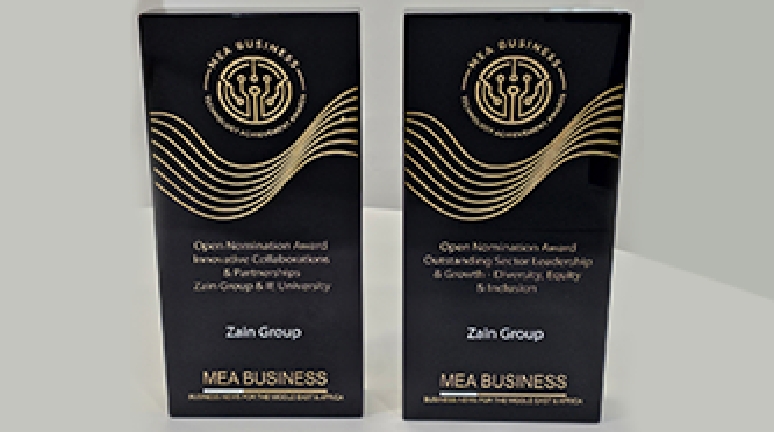
Zain’s Diversity, Equity & Inclusion (DEI) program acknowledged with two awards at the Samena Council endorsed MEA Business Achievement Awards.
-
NOVEMBER

Zain ranks highly (8.4/10) in Global Child Forum’s ‘The State of Children’s Rights and Business 2023’ Benchmark.

Zain Group releases its 2023 Thought Leadership Report entitled, “Building Inclusive Societies Through Connectivity”.
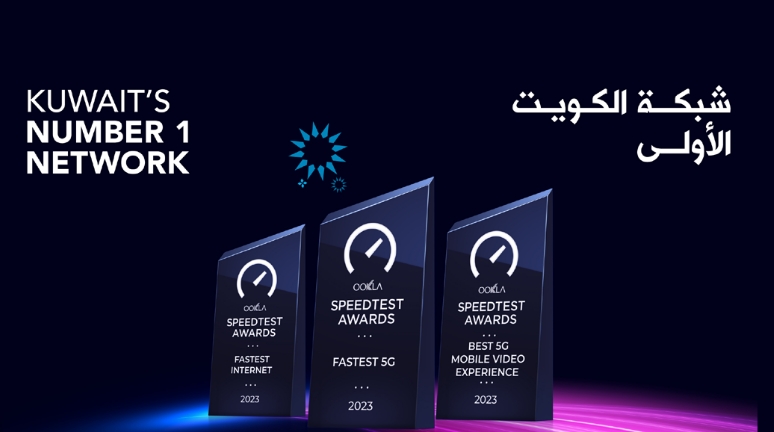
Zain Kuwait becomes the first and only operator in Kuwait to win three major awards in the same year from Ookla Speedtest, for ‘Fastest 5G Network’, ‘Best 5G Video Experience’, and ‘Fastest Internet’.
-
DECEMBER
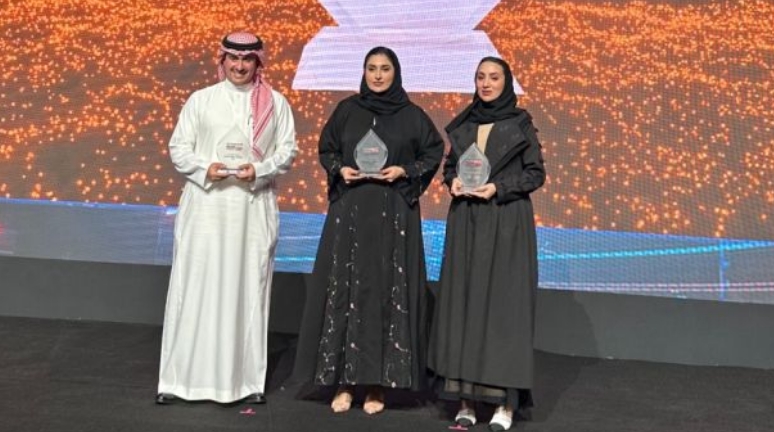
Zain Group and Zain KSA win ‘Best Diversity and Inclusion Program’ Award at the Telecom Review Leaders’ Summit excellence award.
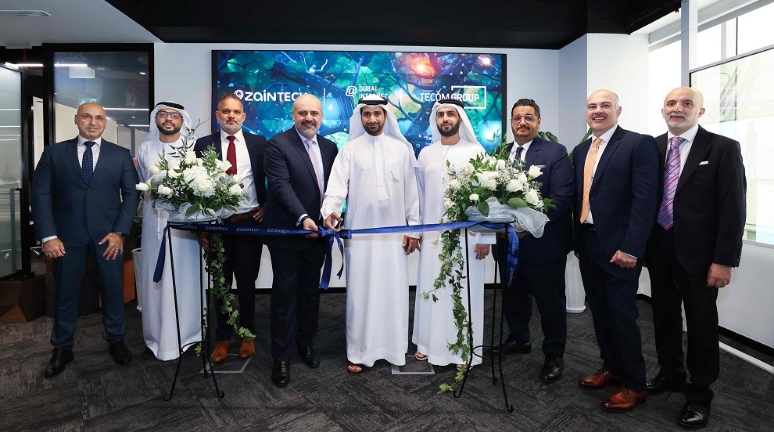
ZainTECH targets regional expansion with inauguration of cutting-edge ICT Hub in Dubai.
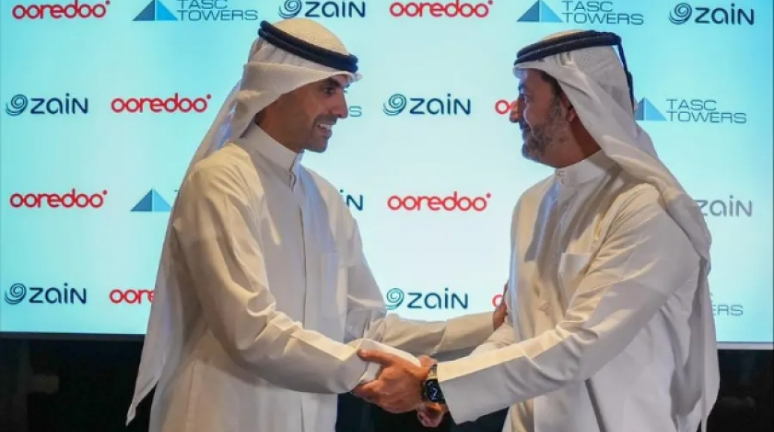
Zain, Ooredoo and TASC Towers create the largest tower company in the MENA region valued at USD 2.2 billion.
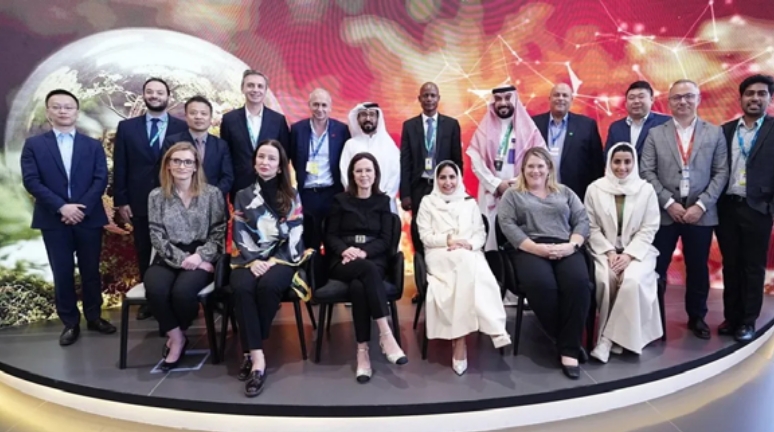
Zain cooperates with GCC Telco Alliance to establish the ‘Sustainability Innovation Hub’.

Zain Jordan launches 5G commercial services, a first for the Kingdom and also rolls out Fixed Wireless Access service for home Internet users.
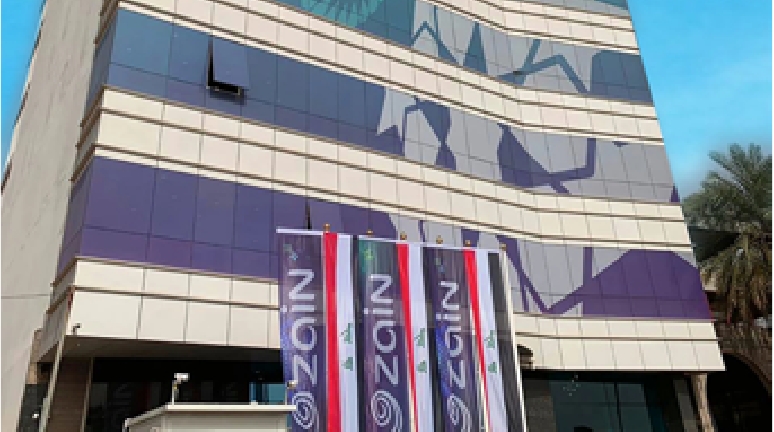
Zain Iraq awarded the ISO 27001:2022 certificate “Information Security for Telecom Services”.
KEY MILESTONES
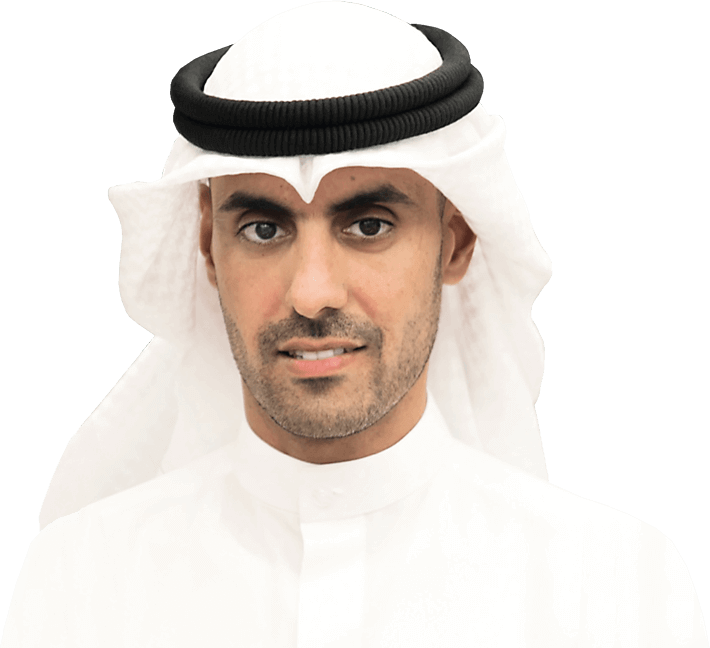
Statement from the Vice-Chairman & Group CEO
- A defining 40th year for Zain
- Strong financial performance results in a cash dividend of 35 fils, a payout ratio of 70%
- Investments in network and technologies driving data and digital services revenue growth
- Fintech innovation and expansion
- Aiming to be the partner of choice for governments and enterprises
- Sale of passive tower networks is a success for efficiency and carbon emission reduction
- Zain Omantel International revolutionizing the wholesale telecommunications sector
- Imperative focus on Regulatory initiatives and Corporate Governance compliance
- Our business has Sustainability and DEI at its core
- Thank you note
- Bader Nasser Al-Kharaf


2023 witnessed the ongoing implementation of our future-proof 4Sight strategy during our 40th year of existence, which turned out to be a defining one for Zain, delivering strong performance, significant milestones, sustainable growth, and value to our customers and stakeholders.
Zain’s Board of Directors and executive management teams have worked effortlessly to overcome socio-economic regional challenges in our markets, where we maximized value creation by investing heavily in our networks, technologies, and people. This resulted in us extending our market leadership in many highly competitive and evolving markets.
The multiple digital transformational initiatives and expansion of new business verticals has driven business growth and positioned Zain firmly as a leading provider of innovative technologies and digital lifestyle communications, delivering meaningful connectivity that empowers societies.
Our focus on catering to the evolving requirements of our individual, enterprise, and government customers has seen our sustainability-conscious mindset develop and proactively act with a sense of urgency, innovating to enhance the digital experiences and introduce appealing, demanded services.
As a result of our efforts, apart from reporting strong operational and financial results for 2023, we were awarded numerous accolades, and saw our brand valuation increase 11% from USD 2.7 billion to USD 3 billion by Brand Finance in its 2024 global valuation report.
This impressive growth in valuation some 16 years after the initial Zain brand launch is testament to the investment the company has placed in establishing its name and identity, and the successful media campaigns, corporate sustainability, diversity, equity, and inclusion initiatives it has instituted over the years. This well-regarded brand is also a reflection of our ongoing innovation and investment in network upgrades that result in quality mobile and data services and exceptional customer experience at every touch point, making Zain one of the most inspirational and recognized corporate brands in the region and beyond.
For the full-year 2023, Zain Group generated consolidated revenue of KD 1.9 billion (USD 6.2 billion), a year-on-year (Y-o-Y) increase of 10%. Consolidated EBITDA for the period increased by 5% Y-o-Y to reach KD 705 million (USD 2.3 billion), reflecting an EBITDA margin of 37%. Consolidated net income reached KD 215 million (USD 701 million), up 10% Y-o-Y and reflecting earnings per share of 50 fils (USD 0.16).
The Board of Directors recommended a cash dividend of 25 fils per share for the second half of 2023.This dividend follows the semi-annual dividend of 10 fils distributed earlier in 2023, totaling 35 fils per share for the year and reflecting a 70% payout ratio, one of the highest among listed entities in the region and in line with the Board’s previously committed minimum cash dividend policy of 35 fils in total, for three years commencing 2023. This policy provides a clear indication of the strength of our financial solvency as we methodically grow the business. The 25 fils dividend recommendation is subject to the Annual General Assembly and statutory approvals.
Throughout 2023, Zain Group invested USD 994 million in CAPEX (16% of revenue), predominantly in 5G rollouts in Kuwait, Saudi Arabia, Bahrain, and Jordan; 4G upgrades and new sites across Iraq, Jordan, South Sudan, and Sudan; expansion of Fiber-to-theHome (FTTH) infrastructure; and spectrum license fees.
Significant investment in network and technology ensures meaningful connectivity to the communities we serve in a reliable and high-speed manner. It also creates value by driving significant growth in data revenues, which grew 8% and reached USD 2.4 billion in 2023, representing 39% of Zain Group’s consolidated revenues for the year.
Of note, Zain Jordan launched 5G commercially in December 2023, becoming the fourth Zain operation to offer this exclusive high-speed and reliable service.
The impressive 9% growth of our Group-wide digital services revenue reflects the many data monetization initiatives maximizing our networks. A key part of this is the ‘Dizlee’ Group API platform, which continues to grow in appeal to customers, partnering with global OTT and solutions providers and offering 81 different digital entertainment innovations around content and gaming, and processing over 275 million payment transactions since launch in mid-2018.
Our digital MVNO operators, Zain Saudi Arabia’s ‘Yaqoot’ and Zain Iraq’s ‘oodi’, continue to deliver healthy customer and revenue growth, offering a simple, all-digital mobile experience that frees customers from the traditional retail buying experience. We will continue to foster these appealing and lucrative business areas and rollout similar dynamic platforms across other markets.
We are keen to foster innovations within the fintech space and continue to innovate and expand mobile financial services across our operating markets, providing much needed services to the communities we serve and driving financial inclusion while contributing to the evolution of the region’s digital ecosystem. During 2023, Group-wide fintech customers grew 40%, with revenue up 195%, and total transaction volume tripling to USD 11 billion.
Early in 2024, we launched the Bede fintech brand in Bahrain, which is set to be rolled out across our footprint. Bede stems from Arabic meaning of “in my hand”. The operation aims to allow everything to be powered in the palm of one’s hand, catering to consumers’ lifestyles and emerging demands beyond basic telecom services. Currently in Bahrain this Shariah-compliant AI powered platform offers consumer micro-finance in minutes over a mobile app and will be developed in the future to offer a variety of financial services and products.
The impressive and profitable growth of TAMAM in Saudi Arabia, and ZainCash in Iraq and Jordan has firmly established these fintech entities as market leaders for the unbanked and underbanked in their respective markets. We will continue to foster their growth through innovation.
In Kuwait, we acquired Bookeey to drive the development of cutting-edge financial solutions and provide advanced, creative offerings through strategic partnerships with banks and Zain Kuwait. Through further innovation, Bookeey will be well positioned to address payment acceptance challenges faced by SMEs in Kuwait, ensuring their financial needs are met.
It was a momentous year for ZainTECH, Zain’s ICT solutions powerhouse, which has grown significantly organically and through acquisitions since its launch in October 2021. The 20% annual growth in B2B revenues across our footprint reflects the synergistic business model between ZainTECH and our local operations’ B2B teams.
Following the closing of the strategic acquisition of leading managed cloud service provider BIOS Middle East, ZainTECH made two other strategic acquisitions during 2023: Adfolks and Specialized Technical Services Company (STS).
The acquisition of Adfolks, a UAE-based cloud transformation services firm brings a wealth of expertise in developing bespoke and agile technology solutions that will enable ZainTECH to drive even more value for its clients in the dynamic and constantly evolving technology landscape by streamlining digital transformation journeys, making it simpler and more seamless than ever.
Furthermore, the agreement to acquire STS, a leading digital transformation solutions provider headquartered in Jordan with vast regional operations comes 20 years after Zain’s first regional expansion into Jordan. With its talented team, years of expertise and impressive 500 customer base across industries, this deal will amplify ZainTECH and Zain B2B teams’ capabilities to provide clients with cutting-edge and comprehensive digital transformation solutions.
In addition to Cloud services, growth areas that ZainTECH is driving include Cybersecurity, IoT, AI, Big Data, Smart Cities, Drones, Robotics, and other emerging technologies. By providing comprehensive ICT services, ZainTECH is paving the way to becoming the digital transformation partner of choice for governments and enterprises across our markets, the UAE, and beyond.
Key parts of the 4Sight strategy center on digital infrastructure and portfolio optimization, extending to the sale and leaseback of the passive infrastructure of our tower network, thereby unlocking capital and allocating resources for more effective and sustainable use. In some markets we have opted to share passive assets with competitors, a process that helps reduce our carbon footprint.
Following the earlier sales of Zain’s tower networks in Kuwait and Jordan, in January 2023, Zain Saudi Arabia completed the sale and leaseback of its 8,069 tower assets to the Kingdom’s Public Investment Fund. Also in January 2023, Zain Iraq entered a 15-year deal to sell and leaseback and permit management rights of its passive physical infrastructure of 4,968 towers to TASC Towers Iraq.
The tower sale and leaseback strategy across these four markets to date has already unlocked over 17,000 towers with a total value of USD 1.3 billion and yielded a net gain of USD 415 million over the years. Out of this, USD 339 million was recognized in 2023.
In December 2023, Zain solidified its position as the regional leader in the tower arena with a pioneering agreement with Qatar’s Ooredoo Group and TASC Towers, which aims to incorporate nearly 30,000 towers across six countries, combining the service providers’ respective passive infrastructure portfolios. The tower deals enhance operational efficiencies and enable a laser focus on service provision, thus providing customers a better mobile and data experience.
Reflecting Zain’s commitment to transforming the business, in a groundbreaking move in May 2023, Zain Group and Omantel announced the launch of Zain Omantel International (ZOI), an unprecedented joint venture that will revolutionize the international wholesale carrier sector. ZOI is creating synergies by optimizing the existing wholesale businesses of both companies by reducing operating costs and increasing competitiveness through access to state-of-theart, low-latency and high-capacity services over its extended footprint.
Quick wins achieved by ZOI during 2023 include plans to establish a digital corridor linking the Indian Ocean, Arabian Gulf, and Mediterranean Sea with Telecom Egypt; another corridor connecting the Red Sea, Indian Ocean, and Arabian Gulf with Europe via Iraq and Turkey; and a partnership with China Mobile International to accelerate the adoption and development of machine-to-machine (M2M), Internet of Vehicles (IoV), and Internet of Things (IoT) technologies across the Middle East.
The regulatory landscape in which Zain Group operates has changed significantly over the last 12 months, impacting all operations as they are subject to crosssector, sector-specific, extraterritorial legislation, regulations, and national licenses. It is critical for Zain to be adaptive in dealing with such complex changes as the future growth of the digital economy depends on developments across multiple industries, technologies, and sectors.
Premised on Zain Group’s 4Sight strategy, the company is now offering a multitude of ICT and digital services beyond traditional telecommunications. As an organization, we are now subject to laws, regulations, policies, directives, and mandates issued by regulators on telecommunications, financial services, data protection, AI, cloud computing, civil aviation (for drones), and climate change. We engage with regulators through active participation at industry forums, regulator-led workshops, meetings with ministers and policy officials, and responses to public and industry consultations initiated by regulatory bodies. We have taken proactive steps to ensure regulatory compliance by instituting a robust regulatory compliance program across the Group.
As a leading listed entity on the Premier Market in Kuwait, with other local listings in Saudi Arabia, Bahrain, and Iraq, Zain Group is proactively exceeding the regulations issued by all governmental financial and regulatory bodies across these markets. Our Investor Relations, Corporate Governance, and Sustainability teams’ high ethical standards, transparent reporting, and professionalism towards all our stakeholders, is promoting investor and market confidence in Zain.
Across our footprint, Zain is guided by the four pillars of our five-year corporate sustainability strategy, centered on Climate Change, Social Business, Inclusion, and Generation Youth. Notably, the A- score that Zain maintained in the latest ‘CDP Score Report–Climate Change 2023’, positioned us first in the region and among leaders globally with respect to climate control initiatives.
We are very proud of the ground breaking partnership between Zain KSA and Red Sea Global that unveiled the world’s first zero-carbon 5G network. This pioneering initiative combines cutting-edge technology with sustainability, providing visitors to the Red Sea project with the region’s fastest 5G connectivity, powered by 100% renewable energy sourced from over 760,000 solar panels.
Our Diversity, Equity, and Inclusion (DEI) program continues to be a positive force within, boosting the company’s productivity and overall morale. It’s rewarding to see this initiative recognized through various external awards.
Women are such an integral part of the Zain success story. From expanding their leadership positions, a revolutionary HR policy, and other innovative talent development programs, Zain’s focus of integrating women fully into all aspects of the business is proving to be an enormous benefit to the culture and productivity of the company.
Today, three Zain operations have already achieved their WE 25% leadership target, with Zain Kuwait at 26.9%; UAE-based ZainTECH at 27.0%; and Zain Jordan at 27.3%.
On behalf of the executive management team, I would like to acknowledge and sincerely thank the talented 8,000-strong Zain workforce, our 51 million customers, the Board of Directors, and government agencies and bodies across our footprint, all of whom contribute to our success in providing meaningful connectivity to the communities we serve.
As we look back at our 40 remarkable years of creating value for our shareholders, serving our customers with absolute pride, I would like to take this opportunity to thank all those that have contributed to the Zain ecosystem over these years.
Our focus for 2024 and beyond remains on the further execution of our corporate strategy, transforming our core telecom business to be more efficient and profitable, while fostering the growth of new business verticals that involve ICT, digital infrastructure, fintech and digital services.
Vice-Chairman & Group CEO
Our Shareholders
New Dividend Policy
Adoption of a minimum cash dividend policy of 35 fils per share for three years, commencing 2023, up from the previous dividends policy of 33 fils per share.
Share price performance
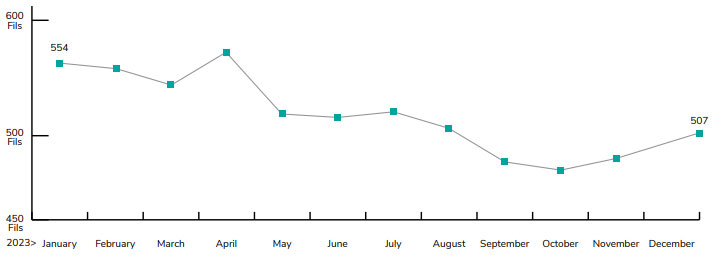
Zain Share Details
Dividends


STRATEGY
4Sight: Creating our Sustainable and Digital Future
The driving force for Zain is its unwavering commitment to creating value for all stakeholders. The 4Sight strategy emerged from the company’s desire to push forward the evolution of digital ecosystems across its footprint, enabling growth and development as well as the establishment of carefully curated growth verticals. In its fifth year, Zain’s 4Sight corporate strategy has seen the transformation of the company into a multi-faceted provider of digital services for consumers, governments, and businesses under the clear direction and guidance of Zain’s leadership.
The following is a brief description of the achievements under each pillar of the strategy.
-
Evolution of Telco

Digital Transformation

Digital Transformation
Guiding and driving the implementation of the Digital Transformation that would permit Zain to not only survive but rather thrive in the Digital Age, Zain has adopted a best-practice-inspired framework for transformation. This is centered on implementing a true customer mindset that drives the development of Products and Services demanded by customers, and investment in technologies that further this cause.
This is supported by a strategic approach to upskilling and hiring of talent and the utilization of Data and Analytics for tactical and strategic decision-making.
A communications strategy has been implemented to get all stakeholder buy-in to assure the true adoption of Zain’s transformation internally and externally.
In 2023, Zain Group intensified its focus on its regional role to develop and support digital transformations by offering state-of-the-art and upcoming technologies such as connected vehicles and modern industry, as well as further organizing its Data Governance and Management guidelines across a number of its subsidiaries.

Enterprise and Government
Enterprise and Government
Zain is committed to working closely with organizations and governments to provide connectivity and the latest solutions to support growth and efficiency. To design and implement state-of-the-art tailor-made solutions for public and private organizations, Zain’s B2B teams work closely with ZainTECH, Zain’s integral digital solutions provider, to drive market development and cross-sell advanced ICT services to differentiate Zain in the regional enterprise market. Zain supports smaller businesses by granting access to a wide range of cloud products and services spanning cloud, cybersecurity, data services, Ai, drones and robotics.

Fixed Connectivity and Convergence
Fixed Connectivity and Convergence
Zain firmly believes that high quality and secure broadband connectivity will enable and accelerate the evolution of information, education, and the digital transformation of societies. Across its footprint, the company strives to provide reliable fixed connectivity to residential and business customers whether through its own deployment of fiber networks or by strategically partnering with third-party providers. This commitment transcends market limitations, where Zain uses fixedlike technologies to fulfill customer needs. Across its markets, customers benefit from the latest broadband connectivity delivered by the company, including 5G, 4G, and FTTH.
Portfolio Optimization
Portfolio Optimization
Zain continues to allocate resources efficiently and sustainably. Following the earlier sales of its tower networks in Kuwait and Jordan, in January 2023, Zain Saudi Arabia (KSA) completed the sale and leaseback of its 8,069 tower assets (passive physical infrastructure) to the Kingdom’s Public Investment Fund (PIF).
In January 2023, Zain Iraq entered a 15-year deal to sell and leaseback and permit management rights of its passive physical infrastructure of 4,968 towers to TASC Towers Iraq.
It should be noted that all Zain operations will retain their active infrastructure, including wireless communication radios, antennas, intelligent software, transmission systems, and intellectual property. These transactions will enhance operational efficiencies and empower Zain operations with greater flexibility to invest in network upgrades and cutting-edge ICT technologies to meet the ever-increasing demand for reliable and high-speed connectivity. The establishment of a special purpose tower company drives the improvement of passive assets and enhances power infrastructure through modernization and investment in alternative power solutions such as solar and wind power production, which significantly reduce carbon emissions.
Reflecting Zain’s commitment to transforming the business, in a groundbreaking move, both Zain Group and Omantel announced the launch of Zain Omantel International (ZOI), an unprecedented joint venture that will revolutionize the wholesale telecommunications sector. ZOI will create synergies by optimizing the existing wholesale businesses of both companies by reducing operating costs and increasing competitiveness through access to state-of-the-art low-latency and high-capacity services over its extended footprint. Combining the strengths of Zain and Omantel positions ZOI is uniquely positioned to evolve into a key player on the international wholesale telecom scene.
-
Growth Verticals
ICT
ICT
Through ZainTECH, enterprises and governments across the region playing a transformational role across Zain’s ecosystem are serviced. ZainTECH boasts an innovative portfolio of solutions spanning cloud, cybersecurity, data services, Ai, drones and robotics. In May 2023, ZainTECH bolstered its cloud positioning by acquiring Adfolks, a UAE-based cloud-native engineering firm that provides a comprehensive range of cloud transformation solutions. In October 2023, ZainTECH entered into an agreement for the complete acquisition of Specialized Technical Services Company (STS), one of the largest digital transformation solutions providers in the region, headquartered in Jordan with operations in Saudi Arabia, the United Arab Emirates, Bahrain, and Iraq. Both these deals follow ZainTECH’s acquisition of BIOS Middle East, a leading provider of Managed Private Cloud Services in the region announced in October 2022 and completed in February 2023.
Additionally, ZainTECH leverages Zain’s footprint and global reach, its vast technological capabilities, and competitive lower upfront capital pricing strategy to offer clients solutions that accelerate digital transformation journeys.

Digital Infrastructure
Digital Infrastructure
Zain continues to partner with TASC Towers Holding, which is a significant part of building its digital infrastructure core, with the aim of unlocking further shareholder value and optimization of infrastructure assets. Zain successfully divested two major portfolios in Jordan and Iraq in the past two years, with TASC becoming a fully operational independent towerco in these two countries. The further expansion of the TASC footprint and the imminent partnership with other MNOs will lead to portfolio densification as well as possible consolidation of redundant sites.
Furthermore, TASC plans to invest a significant amount of its revenues over the next five years on various network modernization initiatives including investment in new battery technologies and modern power generation solutions. Additionally, in the past 12 months, TASC has conducted extensive analysis into different alternative energy solutions including hybrid power systems capitalizing on new battery technologies and solar systems. TASC deployed multiple proof of concepts in various regions. Initial results indicate that there is potential for wide deployment of these solutions, which will result in significant operational efficiencies and a reduction in carbon emissions. In December 2023, Zain solidified its position as the regional leader in the tower arena, with a pioneering agreement with Qatar’s Ooredoo Group and TASC Towers, that aims to incorporate nearly 30,000 towers across six countries, combining the service providers’ respective passive infrastructure portfolios.
Fintech
Fintech
In 2023, Zain scaled its FinTech stream by introducing a suite of digital financial services, contributing to the evolution of the region’s digital ecosystem. Leveraging the innovative products and services developed by FOO, a subsidiary of Zain Group specialized in the FinTech development sector, Zain is keen to foster innovations within the FinTech space through Tamam in Saudi Arabia, Zain Cash in Iraq and Jordan, and soon in Bahrain, Sudan, and Kuwait.
Iraq
- Zain Cash Iraq continued to be the market leader providing financial services to the unbanked in Iraq.
- Staff increased, with 40% female employees, most of them in leading positions.
- Micro-finance loans to be launched in 2024.
- Virtual credit cards allow people to shop online without the need for a bank account.
- 3D face ID authentication for money transfer for more security.
Jordan
- Zain Cash Jordan continued to be market leader.
- Elevating the customer experience with focus on delivering differentiated digital self-services.
- Incorporating valuable additional features to include cashback concept tailored to high value customers.
- Unlocking new possibilities for corporate and small, medium enterprises (SMEs).
Saudi Arabia
- Tamam provides Murabaha financing for customers within minutes.
- One of the fastest growing FinTech companies in the region.
- Launched ‘buy now pay later’ services with Zain KSA and Yaqoot.
Kuwait
- Zain acquired Bookeey to offer advanced, creative offerings through strategic partnerships with banks and Zain Kuwait, fostering innovation.
- Addressing the payment acceptance challenges faced by SMEs in Kuwait, ensuring their financial needs are met.
- Expanding Bookeey’s product and service portfolio to cater to a wider audience, enhancing financial solutions for a variety of end users.
- Strengthening collaborations with partner banks and Zain Kuwait to drive the development of cutting-edge financial solutions.
M-Gurush South Sudan
- Enhanced the partnership agreement with m-Gurush to collaborate in providing innovative financial products and services to Zain customers.
Bahrain
- Acquired a FinTech license from the Central Bank of Bahrain.
- Tech implementation with partner bank in progress.
- Expected commercial launch of FinTech services in early 2024.
Sudan
- A FinTech company has been registered as per regulatory requirements.
- Approval received from Central Bank of Sudan to launch FinTech services.
- Working on restoring servers and amending apps after the failure of the national switch system.
- Expected commercial launch of FinTech services in December 2023.
Digital Services
Digital Services
Zain Ventures spearheads Zain’s investment portfolio, with the aim to diversity the company’s reach and leverage future investment opportunities. Zain expanded its relationship with regional and international venture capital funds and continued to diversify its portfolio through direct investments offering them access to Zain’s wide geographical reach and expansive customer base.
-

BECO Capital Fund III is an early-stage venture capital fund managed by BECO Capital. The fund is located in Dubai, United Arab Emirates, and focuses on technology start-ups.
-

This women-founded venture fund targets seed and early-stage technology companies in industries such as fintech, IoT and healthcare, and is based in the United States. The company invests in organizations that focus on ESG-related activities from business practices to economic and environmental impacts.
-

Headquartered in Dubai, Wamda MENA Venture I invests in growth stage technology companies operating in the MENA region. The fund has made investments in industries that are of interest to Zain such as insuretech.
-

A MENA-centric fund targeting early-stage technologies in new media, e-commerce, and enterprise software as a service (“SaaS”). This fund presents synergies with Zain’s digital health and insuretech plans.
-

A growth-stage fund focusing on Series B technology start-ups in MENA and Turkey.
-

Valor Fund is managed by Valor Equity Partners, an operational growth investment firm focused on high growth companies across different industries and stages of development.
During 2023, Zain Ventures’ portfolio included:
-

A Canadian multinational technology company focused on artificial intelligence (AI) for the enterprise, specializing in Large Language Models.
-

A US-based FinTech company that successfully developed a trading platform that transforms recurring revenue into up-front capital for growth without debt or dilution.
-

A leading British FinTech company that offers banking services including GBP and EUR bank accounts, debit cards, fee-free currency exchange, equities, and cryptocurrency trading, as well as peer-to-peer payments.
-

Zain made a direct investment in ZoodPay’s series B USD 38 million fundraising round, where the ZoodPay and ZoodMall apps count over 8 million users and 10 offices across the Middle East and Central Asia. The application provides a mobile-only high-quality shopping experience and cross-border services to merchants and shoppers across emerging markets.
Direct Investment:
Dizlee: Evolving into a 360° Digital Ecosystem Monetization Platform
In 2023, Zain enhanced its regional presence and amplified its digital service offerings, introducing services to broaden its accessibility to all. Utilizing the Dizlee API platform, the company ensured continuous connectivity and engagement for both individual and enterprise customers. By introducing a variety of services, Zain operations and Omantel leveraged the platform to expose their APIs to the digital economy, removing a significant barrier to the development of profitable digital partnerships from across the globe.
The API platform allows Zain customers to connect with various services such as entertainment, education, social networking, and health.
To date, 275 million transactions have been processed over the platform, with a reach of 50 million customers.
In 2023, the following services were added to the program:
- XR Academy: An extended reality-based educational program that offers customers of all ages access to a unique lineup of educational games and videos. Being device agnostic, the program does not require the user to purchase expensive VR headsets or any other special device to access it.
- Golden Steps: A gamified platform that rewards its users for completing daily and weekly fitness goals, usually the number of steps completed. The rewards are in the form of discount coupons with local and regional online/ offline partners. The app uses the phone’s pedometer to track steps and can also be connected to various fitness bands and smartwatches.
- Salamtak (Micro-insurance application from Crosure): A company offering various insurance services in Iraq. With Zain, they offer the ‘Salamtak’ life insurance product, where the user can subscribe online using a few simple steps, and the premium can be paid through operator billing.
- Mindplus: A web-based service offering online consultation on mental health and wellbeing from global experts, translated in Arabic and Kurdish. Consultation is usually delivered as short videos and/or regular text-based updates.
- Fenix e-scooters: Fenix is one of the first companies in the region that allows consumers to rent e-scooters with weekly and monthly subscriptions, and enables business users to carry out last-mile deliveries on these scooters – thus offering them an emission-free local transportation option. Dizlee has enabled Zain KSA customers to use their mobile device to rent e-scooters from Fenix.
- Ahlan Simsim: A program under Sesame Workshop, offering content that fosters early learning for young children in the Middle East and North Africa, especially those affected by crisis and displacement. The program can be found in the Zain Kids application.
Throughout the year, Zain esports maintained its focus on the youth segment, actively exploring new opportunities for various broadband services. Hosting numerous tournaments and engagement activities, Zain esports not only showcased its commitment to the gaming community but also provided a platform to nurture e-gaming talent in the region. This included the selection of Arabic-speaking commentators and promotion of local esports teams, aiming to propel their profile globally.
Zain esports established a joint venture with Zain KSA and PLAYHERA, an esports platform hub created for “gamers by gamers” headquartered in Saudi Arabia. Through this venture, Zain esports plans to launch an ambassador program for up-and-coming gamers in the region as follows:
- Creating a conducive environment for esports content creators
- Supporting local social media influencers to promote leagues among local gamers.
- Creating employment opportunities in the region, given youth unemployment is considered one of the region’s greatest challenges.
-
40+
Major Tournaments Conducted
-
13.5K
No of Participants
-
100M+
Social Media Impressions
-
220K
Follower Count Across Social Media Platforms
-
800K
Viewership across Channels
ZAIN KUWAIT
The Group’s flagship, Mobile Telecommunications Company (Zain), was founded in Kuwait in 1983, becoming the first telecom operator to launch a commercial GSM service in the region in 1994. Listed on the Boursa Kuwait in 1985 and now on its Premier market, incorporating all the Group’s operations and assets across all markets, Zain Group’s market capitalization stood at USD 7 billion (at a share price of 507 fils) as of December 31, 2023.
The Group’s most profitable operation delivered a strong set of results, maintaining its market leadership, with its customer base increasing by 4% in 2023 to reach 2.7 million customers. Revenue grew by 5% to reach KD 360 million (USD 1.2 billion), EBITDA grew by 18% to KD 156 million (USD 509 million), representing an EBITDA margin of 43% while net income increased 26% to KD 104 million (USD 339 million). EBITDA and net income include claims related to winning number range fees of KD 24.68 million (USD 80 million) for which the full amount was received in 2023.
In 2023, Zain Kuwait invested USD 151 million in CAPEX to enhance its 5G mobile and broadband services, significantly boosting revenues, especially in the Enterprise sector. This CAPEX and superior nationwide network were instrumental in capturing the largest 5G customer and revenue market share in the country, a testament to Zain Kuwait’s commitment to innovation and customer service.
Towards the end of the year, Nawaf Hisham Al-Gharabally was appointed acting CEO of Zain Kuwait, later ratified as CEO in March 2024. A Kuwaiti national with a 25-year tenure at Zain, prior to this appointment, Al-Gharabally, was Zain Group and Zain Kuwait Chief Technology Officer, leading the pioneering launch of 5G services in Kuwait in 2019 as well as being a key part of the Zain Group executive management team.
Aiming to become the first telco-led digital bank in the country, Zain Kuwait’s fintech aspirations are awaiting the approval of its digital banking application to be announced in 2024. Once launched, Zain aims to revolutionize the digital banking experience for its customers, providing them with greater flexibility and convenience.
Looking to the future, the operator is focused on delivering sustainable growth and creating long-term value for shareholders, while continuing to provide innovative solutions and exceptional service to customers.
Commercial and technological highlights:
- Award-Winning Network: Zain received three prestigious accolades from Ookla Speedtest, including Best 5G Fixed Network, Best Fixed Network, and Best 5G Video Streaming.
- Max Internet Plans: Launch of innovative internet plans exceeding traditional offerings, providing customers with more value by partnering with eight content providers, including Disney+, Shahid, TOD, OSN+, Starzplay, Viu, and Kaspersky. Customers enjoy seamless access to an exceptional 5G network and unlimited streaming across major platforms, all bundled into one comprehensive plan.
- Red Bull Mobile Partnership: Introducing an unparalleled telecom experience, this partnership merges connectivity with adventure, offering customers not just telecom services, but an opportunity to dive into the extraordinary world of Red Bull. It targets the youth market, offering appealing options for prepaid voice and internet services.
- Green Energy Focus: Entered new agreements for renewable energy solutions at five solar sites as well as deploying four green power solutions (hybrid and solar power outdoor equipment).
- Received Certification of Data Centers by Uptime Institute and entered a hyper-scaler solution agreement with Google.
- Successfully trialed 5.5G technology, achieving speeds of 10 Gigabits per second as well as testing Ultra-Reliable Low Latency Communication (URLLC), a key 5.5G feature.
-
0
YEAR OF LAUNCH -
0G
TECHNOLOGY -
0m
CUSTOMERS -
0TB
AVG. DAILY DATA VOLUME
-
$0
ARPU -
0%
OWNERSHIP -
0%
MARKET SHARE -
0%
EBITDA MARGIN -
0%
DATA REVENUE -
$0m
CAPEX -
0%
MARKET PENETRATION -
⭡0%
B2B
| Operational & Financial Performance | 2023 | 2022 | Growth |
|---|---|---|---|
| Operational & Financial Performance | 2023 | 2022 | Growth |
| Customers (000s) | 2,706 | 2,603 | 4% |
| Revenue (USD m) | 1,173 | 1,118 | 5% |
| EBITDA (USD m) | 509 | 434 | 18% |
| EBITDA % | 43% | 39% | – |
| Net Profit (USD m) | 339 | 270 | 26% |
| ARPU | $24 | $25 | – |
| CAPEX (USD m) | 151 | 103 | 46% |
Zain Saudi Arabia
Zain KSA launched commercial operations in the Kingdom on August 26, 2008, a year after it was awarded its mobile license. Zain Group holds a 37% equity stake in the operation, while the remaining shareholding is held by a Saudi consortium that owns 21%, and 42% is free floating on the Tadawul Stock Exchange (ZAIN KSA, 7030). The company’s market capitalization stood at approximately USD 3.4 billion as of December 31, 2023, reflecting a share price of SAR 14.1.
The operator reported all-time high revenues and net profit in 2023, with revenue of USD 2.6 billion, up 9% Y-o-Y. EBITDA reached USD 794 million, reflecting an EBITDA margin of 30%. Net income for the year soared 131% to USD 338 million, inclusive of the gain from the sale and leaseback of towers during 2023.
The operator’s data revenue represented 40% of total revenue, which grew by 2%, while active customers stood at 8.9 million, which was up 3%.
For the second consecutive year, the Board of Directors recommended a cash dividend to shareholders for the year 2023 at a rate of 5% of the nominal share value.
Zain KSA continued to make significant investments in CAPEX, investing USD 253 million in expanding its 5G network coverage and enhancing 4G LTE capacity.
The operator’s 5G, B2B, Yaqoot, TAMAM, and fintech services witnessed impressive Y-o-Y growth in revenue. 5G witnessed a 40% revenue growth, B2B was up 19%, Yaqoot – Zain KSA’s digital operator arm, witnessed 82% growth in revenue, and TAMAM – the consumer microfinance arm, witnessed 124% increase in revenue Y-o-Y.
The successful completion of the tower transaction saw Zain KSA selling 8,069 towers to PIF for USD 807 million.
Commercial and technological highlights:
- Zain KSA secured top position in 5G coverage across 11 of 13 regions.
- Focus on maximizing the 5G network present in over 54 cities, powered by the introduction of a new home fiber and 5G package bundles.
- Achieved a significant milestone by being ranked as the top operator in mystery shopper W3 in KSA.
- Substantial 58% increase in total revenue from devices, facilitated by the efficient fulfillment hub shipment service across all B2C and B2B channels.
YAQOOT: A digitally focused mobile-only app that offers various connectivity packages that deal with data and unlimited services, allowing customers to choose apps from a diverse list, and to gift one another vouchers, greetings cards, data, and minutes. The digital operator’s active customer base increased 44% Y-o-Y.
TAMAM: The consumer microfinance entity is investing heavily in developing its app platform. Welcoming open banking for improved underwriting, concurrent loans were introduced, with the elevation of the user experience driving new registrations and disbursement of loans. Adhering to cybersecurity standards certification, and implementing Privilege Access Management, TAMAM also established a dedicated customer care office resulting in 90% customer response rates. The company is currently finalizing the integration of a virtual card and is awaiting Central Bank approval to go live.
PLAYHERA: In 2022, Zain KSA and Zain esports announced the formation of a new gaming powerhouse, PLAYHERA MENA, a joint venture (JV) targeting the region’s lucrative gaming market, with an estimated 100 million gamers. PLAYHERA’s dynamic interactive platforms and huge global player base saw it attract an impressive 32,000 gamers with revenues mainly from activation programs, e-commerce, tournaments, and sponsorships. The JV’s Board appointed a new CEO in December 2023.
Red Sea Global – the world’s first zero-carbon 5G network In August 2023, Zain KSA in partnership with Red Sea Global (RSG) and Amaala, unveiled the world’s first zero-carbon 5G network at The Red Sea. The zero-carbon 5G network will deliver 5G connectivity to guests, powered 100% by renewable energy from over 760,000 solar panels that have been built to power the entire 28,000km2 destination. Notably, Zain KSA and Red Sea Global won the ‘Best Green Technology’ award at the Telecom Review Leaders’ Summit 2023.
-
0
YEAR OF LAUNCH -
0G
TECHNOLOGY -
0m
CUSTOMERS -
0TB
Average Daily Data Volume
-
$0
ARPU -
0%
OWNERSHIP -
0%
EBITDA MARGIN -
0%
DATA REVENUE -
$0m
CAPEX -
0%
MARKET PENETRATION -
⭡0%
B2B
| Operational & Financial Performance | 2023 | 2022 | Growth |
|---|---|---|---|
| Operational & Financial Performance | 2023 | 2022 | Growth |
| Customers (000s) | 8,892 | 8,644 | 3% |
| Revenue (USD m) | 2,634 | 2,421 | 9% |
| EBITDA (USD m) | 794 | 842 | -6% |
| EBITDA % | 30% | 35% | – |
| Net Profit (USD m) | 338 | 147 | 131% |
| ARPU | $17 | $17 | – |
| CAPEX (USD m) | 253 | 242 | 5% |
Zain Iraq
Zain has been providing mobile services in Iraq since December 2003. After securing a 15-year license in August 2007 and a further extension to 2030 that included a 4G license, the operator has grown to become the largest mobile operator in the country, with an approximate market capitalization of USD 3.3 billion as of December 31, 2023.
Zain Iraq has achieved tremendous results across multiple financial metrics, recording its best results in four years. The operator’s customer base reached 17.9 million customers.
2023 revenue grew 20% Y-o-Y to reach USD 974 million, due to better operational performance and significant improvement in the macroeconomic environment in the country such as appreciation of IQD against USD (from 1470 to 1320) and removal of 20% sales tax on telecom services. EBITDA increased by 16% to USD 375 million, with an EBITDA margin of 39%. Net income for the period soared 476% to reach USD 88 million, inclusive of the tower transaction gain.
Zain Iraq finalized the sale and leaseback and management rights of 4,968 towers to TASC Towers Iraq (a subsidiary of Zain Group) for USD 180 million. Zain Iraq recognized a gain of USD 32 million, which is eliminated at Group level.
In 2023, Zain Iraq invested USD 195 million in CAPEX, focusing primarily on enhancing LTE coverage in major cities such as Baghdad and Basra, while also expanding into new cities.
The digital operator, Oodi, soared to new heights of success, surpassing the majority of its set targets and achieving profitability for the first time in 2023. This remarkable growth trajectory was characterized by robust ARPU and revenue growth with its active customer base more than doubling over the year, reflecting a strong demand for digitalonly operators.
The company’s fintech arm, Zain Cash, has also experienced exponential growth, doubling the number of transactions compared to last year, and is projected to continue growing at a similar pace in the coming years.
Commercial and technological highlights:
- The introduction of the super card offering saw Zain Iraq double down on its strategy of shifting customer behavior towards a subscriptionbased model, with extraordinary growth in the super cards. This is the first compound bundle as a physical scratch card in the market.
- Reinforced Zain’s market leadership in mobile broadband through a multi-faceted strategy leveraging the operator’s best-in-class network, a tailored sales channel approach, and introducing the latest technology routers to the country.
- Capitalized on its mobile broadband competitive edge with improved router device pricing, enhancing its renewals and attracting new customers.
- Forged exclusive partnerships with renowned social media brands across various sectors including YouTube Premium, Spotify, La Liga and Snapchat, amplifying Zain’s brand reach and establishing a dominant presence in target segments, particularly the youth market. The operator introduced 55 new services and has 7 million followers on Facebook.
- Expanded device offerings significantly by securing the rights as the sole telecom provider distributing Samsung devices in the country through Zain Iraq’s subsidiary NextGeneration.
-
0
YEAR OF LAUNCH -
0G
TECHNOLOGY -
0m
CUSTOMERS -
0TB
Average Daily Data Volume
-
$0
ARPU -
0%
OWNERSHIP -
0%
MARKET SHARE -
0%
EBITDA MARGIN -
0%
DATA REVENUE -
$0m
CAPEX -
0%
MARKET PENETRATION -
⭡0%
B2B
| Operational & Financial Performance | 2023 | 2022 | Growth |
|---|---|---|---|
| Operational & Financial Performance | 2023 | 2022 | Growth |
| Customers (000s) | 17,920 | 18,405 | -3% |
| Revenue (USD m) | 974 | 810 | 20% |
| EBITDA (USD m) | 375 | 323 | 16% |
| EBITDA % | 39% | 40% | – |
| Net Profit (USD m) | 88 | 15 | 476% |
| ARPU | $4 | $4 | – |
| CAPEX (USD m) | 195 | 180 | 8% |
Zain Sudan
In February 2006, Zain acquired a 61% stake in Mobitel, Sudan’s first mobile operator, in a deal valued at USD 1.33 billion. Rebranded to Zain in September 2007, the operator subsequently renewed its license for a period of 20 years.
Navigating through a very challenging landscape, Zain Sudan was able to mitigate the impact of conflict and country instability on its operations. Against all odds, Zain was able to achieve a solid topline and EBIDTA performance in 2023, due to the timely decisions and actions taken by management to ensure the continuity of communication services and operations.
The outlook for the immediate future is uncertain given the network blackout experienced by all operators in February 2024. Commencing March 2024, Zain Sudan restored its services in Port Sudan and other neighboring states by establishing a new switch and data center in the region.
For 2023, the operation reported 14% growth in revenue driven by continuous price revamps. EBITDA grew 7% to reach USD 269 million, reflecting an EBITDA margin of 48%. Net income for the period reached USD 216 million. The customer base reached 14.2 million, maintaining its market leadership. Data revenue grew 22%, representing 35% of total revenue.
Commercial and technological highlights:
- Zain Sudan was the only operator to continue providing connectivity during social conflict challenges, focusing on introducing digital payment channels, expanding shops, point-of-sales locations, establishing contact centers in non-war zone cities, and increasing remote agents, along with introducing favorable data roaming packages, reinforcing connectivity solutions and community commitment, along with free access to WhatsApp and Facebook.
- Maintenance team heroes combated significant fiber cut incidents in a hazardous area, risking their lives to ensure proper service levels to customers.
- Damages to property and equipment due to the ongoing unrest amounted to USD 48 million, which has insurance coverage.
- Price revamps to counteract currency devaluation: The operation increased prices in February and September 2023 and negotiated lower international termination rates with carriers and operators.
- Plans to establish three disaster recovery sites in Port Sudan (active), Madani, and Atbara, in case of a disaster in Khartoum switches.
-
0
YEAR OF LAUNCH -
0G
TECHNOLOGY -
0m
CUSTOMERS -
0TB
Average Daily Data Volume
-
$0
ARPU -
0%
OWNERSHIP -
0%
MARKET SHARE -
0%
EBITDA MARGIN -
0%
DATA REVENUE -
$0m
CAPEX -
0%
MARKET PENETRATION -
⭡0%
B2B
| Operational & Financial Performance | 2023 | 2022 | Growth |
|---|---|---|---|
| Operational & Financial Performance | 2023 | 2022 | Growth |
| Customers (000s) | 14,178 | 16,358 | -13% |
| Revenue (USD m) | 558 | 489 | 14% |
| EBITDA (USD m) | 269 | 250 | 7% |
| EBITDA % | 48% | 51% | – |
| Net Profit (USD m) | 216 | 236 | -8% |
| ARPU | $3 | $2 | – |
| CAPEX (USD m) | 109 | 94 | 17% |
Zain Jordan
In 1994, Zain Jordan revolutionized the telecom sector in the Kingdom by becoming the first operator to introduce mobile services (as Fastlink). In 2003, the operator notched up another first by joining Zain Group’s Middle East portfolio, and despite intense competition in this liberalized market, the operator was the first to launch 4G services. Zain Jordan has maintained its status as the country’s leading mobile entity from inception. The operator continued its legacy of innovation by introducing 5G services towards the end of 2023, cementing its commitment to technological advancement and customer satisfaction.
During 2023, the customer base increased 3% Y-o-Y to serve 3.9 million active users. Revenue and net income grew by 3% and 10% respectively, while EBITDA decreased by 10% compared to last year. The operation maintained a healthy EBITDA margin of 41%.
Data revenue grew 1%, representing 50% of total revenue. In addition to the recent 5G rollouts, Zain Jordan continues expanding its fiber network to 300 sites, increasing its reach to 60% and more than 280,000 households in 2023.
Zain invested USD 163 million in CAPEX during 2023, mainly on 5G network rollout, 4G LTE enhancements, and FTTH deployments to new areas.
Commercial and technological highlights:
- 5G Launch: In December, Zain Jordan introduced 5G services reaching 350 sites in Amman, with data speeds up to 1.7Gbps.
- Zain FTTR: Zain Jordan was the first in the market to introduce Fiber-To-The-Room, a groundbreaking indoor connectivity solution using fiber cables for ultra-fast internet speeds throughout a customer’s home.
- Zain Fiber: Zain Jordan expanded its fiber network to refugee camps, making it the first telecom operator in the Kingdom to provide such services in impoverished areas.
- Consumer Subsidy: Introduced an online platform for postpaid GSM customers to enjoy a discounted subsidized device by using a promo code on the e-shop.
- Apple Pay: iPhone users on the Zain Jo app are offered the convenience of recharging or settling their invoices directly using Apple Pay. Additionally, they can make retail product purchases from the e-shop using Apple Pay.
- Comprehensive initiatives to upgrade customers’ digital experience by improving login process, which significantly impacted user satisfaction, streamlining the process to purchase prepaid lines and offering direct discounts. Also, the operator implemented a recurring payment option for postpaid customers and introduced promotions like the spin and win campaign to engage users.
- Paperless shop: The Paperless Project seeks to digitize the entire contract management life-cycle across all retail outlets.
- Bunker awarded Uptime Tier III TCOS (Tier Certification Operational Sustainability) Gold level: The third facility certification from the Uptime Institute, indicates that the Bunker facility operates under optimal operational and maintenance scenarios, following best practices, and ensuring 99.982% facility availability.
- Launched Oracle EXACC as a service: In cooperation with ZainTECH, Zain Jordan introduced Oracle Database Exadata Cloud at Customer (EXACC) as a service, hosted at the Zain Bunker and managed by the ZainTECH team. This setup marks a unique offering in Jordan, being the first to provide EXACC as a service with an OPEX model from a centralized node located within the country. This approach caters to the needs of enterprise customers by addressing regulations, offering a favorable financial model, and providing access to the latest Exadata features through a local cloud setup.
- Zain FTTO: (Fiber-To-The-Office) Zain Jordan was the first in the market to introduce Fiber-To-TheOffice, revolutionizing indoor connectivity, offering an unparalleled high-speed internet experience throughout offices. The service now ensures seamless and ultra-fast internet connectivity in every office.
- B2B mobile services growth and acquisitions: Zain Jordan achieved remarkable success in the B2B segment by sustaining the highest market share, coupled by significant growth in the SME segment, surpassing targets.
-
0
YEAR OF LAUNCH -
0G
TECHNOLOGY -
0m
CUSTOMERS -
0TB
Average Daily Data Volume
-
$0
ARPU -
0%
OWNERSHIP -
0%
market share -
0%
EBITDA MARGIN -
0%
DATA REVENUE -
$0m
CAPEX -
0%
MARKET PENETRATION -
⭡0%
B2B
| Operational & Financial Performance | 2023 | 2022 | Growth |
|---|---|---|---|
| Operational & Financial Performance | 2023 | 2022 | Growth |
| Customers (000s) | 3,911 | 3,788 | 3% |
| Revenue (USD m) | 525 | 512 | 3% |
| EBITDA (USD m) | 217 | 240 | -10% |
| EBITDA % | 41% | 47% | – |
| Net Profit (USD m) | 76 | 69 | 10% |
| ARPU | $11 | $11 | – |
| CAPEX (USD m) | 163 | 200 | -18% |
Zain Bahrain
Zain Bahrain began commercial operations in the Kingdom in December 2003 as MTC Vodafone until rebranding to Zain in 2007. With its pioneering efforts in rolling out the latest technologies, Zain has played a key role in placing Bahrain on the global telecom map. Zain is listed on the Bahrain Bourse (ZAINBH) with a market capitalization of approximately USD 130 million as of December 31, 2023.
Zain Bahrain demonstrated remarkable progress in expanding its infrastructure and services throughout the past year. For the full-year, the operator generated revenue of USD 192 million, up 7% Y-o-Y. EBITDA increased 2% to USD 60 million, reflecting an EBITDA margin of 31%. Net income increased 2% to USD 15.4 million, with data revenue growing 6% to represent 47% of total revenue.
This growth was facilitated by the company’s ongoing focus on upgrading its infrastructure and adopting cuttingedge technologies to provide customers with the best possible service.
The company has focused on enhancing indoor coverage in major establishments and improving home broadband connectivity, particularly in newly developed areas. With an investment of USD 34 million in CAPEX, Zain Bahrain expanded its 5G network coverage and capacity.
Commercial and technological highlights:
- Introduction of Wiyana Postpaid Family Plan – Share, Save, and Control making Zain Bahrain the first operator in the market to launch a family plan with exclusive features like parental and sharing controls. Introduced multiple plans based on family size, awarding up to five voice lines and high-speed broadband connections.
- Initiated a series of successful fiber campaigns, including “Save more with Zain Fiber,” “Win 5 Audi cars,” and “Fiber Cash.”
- Merchant offers for Zain customers as part of the company’s lifestyle offerings. Zain customers can interact with up to 60 merchants through a dedicated page on the Zain app. Merchants are changed monthly for greater options, with customers enjoying discounted, free, and combo offers.
- Launch of Zain esports Lab, which is an innovative, bespoke venue designed and equipped to deliver esports tournaments, training workshops, and community events. As Bahrain’s first esports tailored training program launched in November, the event attracted over 300 participants to more than 35 esports tournament days. The Zain esports Lab venue is now officially recognized as an esports facility for official tournaments on popular esports information website, Liquipedia, which counts 300+ participating players. The Lab aims to enhance production, broadcasting, and esports operations skills.
- Launch of the ‘Bede’ fintech brand in Bahrain in February 2024. The Shariah-compliant, AI powered platform offers consumers microfinance loans that will be developed in the future to offer a variety of financial services and products.
- Technological achievements: Implemented first hybrid solar power deployment (15% initial CO2 reduction). Also launched advanced Samsung eSIM transfer feature and implemented live anti-spoofing and signaling firewall for network protection as well as successfully trialing Enhanced Voice Service (EVS), making Zain the first to do so in Bahrain.
-
0
YEAR OF LAUNCH -
0G
TECHNOLOGY -
0TB
Average Daily Data Volume
-
$0
ARPU -
0%
OWNERSHIP -
0%
EBITDA MARGIN -
0%
DATA REVENUE -
$0m
CAPEX -
0%
MARKET PENETRATION -
⭡0%
B2B
| Operational & Financial Performance | 2023 | 2022 | Growth |
|---|---|---|---|
| Operational & Financial Performance | 2023 | 2022 | Growth |
| Revenue (USD m) | 192 | 179 | 7% |
| EBITDA (USD m) | 60 | 58 | 2% |
| EBITDA % | 31% | 33% | – |
| Net Profit (USD m) | 15.4 | 15.2 | 2% |
| ARPU | 17 | 17 | – |
| CAPEX (USD m) | 34 | 38 | -10% |

REGULATORY AFFAIRS
Zain Group’s operations are subject to cross-sector, sector-specific, extraterritorial legislation, regulations, and national licenses. The growth of the future digital economy depends on developments across multiple industries, technologies, and sectors. Furthermore, the regulatory landscape has significantly altered in the last 12 months.
The World Radiocommunications Conference (WRC-23), organized under the auspices of the International Telecommunication Union (ITU) and hosted by the United Arab Emirates (UAE), witnessed governments agreeing to a roadmap for the allocation of more spectrum for mobile services in Europe, the Middle East, and Africa (EMEA) – including low-band spectrum in the 470-694 MHz band, harmonization of the 3.3 – 3.8 GHz bands, and countries representing over 60% of the world’s population identifying the 6.425 – 7.125 GHz band (6 GHz) for licensed mobile use.
With the launch of Generative AI tools such as ChatGPT (OpenAI), Character.ai, Quillbot, Gemini (Google), perplexity. ai, and claude.ai, national regulatory authorities across the globe have begun to develop legislation to regulate the use of artificial intelligence (AI) and modify existing personal data protection legislation to cater to the processing of personal data via autonomous and semi-autonomous systems such as AI.
The 2023 United Nations Climate Change Conference (commonly known as COP28) held in the UAE in NovemberDecember 2023 saw nations formally agree to ramp up renewable energy rapidly and to accelerate decarbonization with over 50 companies representing 40% of global oil production signing a decarbonization charter to achieve net zero emissions by or before 2050.
Premised on Zain Group’s ‘4Sight’ strategy, the company is now involved in broad areas of ICT (traditional telecommunications services, passive and active infrastructure sharing and tower management and ownership, cloud computing, drones and robotics, cybersecurity, digital financial services, InsurTech, and others). As an organization, we are now subject to laws, regulations, policies, directives, and mandates issued by regulators on telecommunications, financial services, data protection, AI, cloud computing, civil aviation (for drones), and climate change. We engage with regulators through active participation at industry forums, regulator-led workshops, meetings with ministers and policy officials, and responses to public and industry consultations initiated by regulatory bodies. We have taken proactive steps to ensure regulatory compliance by instituting a robust regulatory compliance program across the Group.

Regulatory Focus Areas
Underpinned By Regulatory Compliance
WHERE TO PLAY ?
-

Spectrum & Technical Regulations
Spectrum & Technical Regulations
- Spectrum Management & Technical Regulation
- Radio Access Network Spectrum
- Microwave Backhaul Spectrum
- National Spectrum Roadmaps
- Cross Border Frequency Coordination
The finalization of the frequency spectrum license auction in 1800 MHz in Sudan and the grant of 1800 MHz and 2100 MHz spectrum, following the conclusion of the settlement agreement in Jordan, represented vital achievements. A significant development was finalizing the cross-border agreement between Iran and GCC countries for efficient spectrum utilization and minimization of interference in 2.6 GHz and 3.5G Hz bands.
New Spectrum Acquisition & Auctions
Jordan
- Acquired 2×10 MHz in1800 MHz band.
- Cost of JD 35.5m based on the settlement agreement.
- 2×5 MHz in 2100 MHz (Annual fee JD 100K).
Kuwait
- To expand spectrum availability in Kuwait, CITRA is contemplating granting spectrum in the band n40 (2300 – 2400 MHz) and restructuring the 2.6 GHz band from band 7/38 to band n41 to grant MNOs up to 290 MHz of spectrum.
- The grant may be offered as a managed assignment or through an auction.
Saudi Arabia
- Although the CST announced the auction of 600, 700, 3800-400 MHz to take place on the 16 Oct 2023, auction has been postponed again.
Sudan
- In Q1 2023, auction was concluded, and Zain won the remaining last 2 x 10 MHz in the 1800 MHz band at USD 37 mln
- Payments will be made in 4 installments (15%) with 40% paid in 2023 in SDG at CBoS rates at the payment times.
Iraq
- Ongoing advocacy efforts by MNOs to address QoS targets, spectrum availability and spectrum pricing to align these with international standards.
- Extensive workshops held in Q4 2023 to address QoS and to lower spectrum pricing.
Kuwait
- 3G Shutdown contemplated – The banking network and payment ecosystem, reliant on 2G/3G POS devices has signaled readiness to swap POS machines from 2G/3G to 4G/5G.
- Joint lobbying effort by GSMA, ITU, MNOs on spectrum, site regulations, business guidelines, unified License and FTTH.
GCC & Iran –Cross border Interference
- Cross-border agreements between Iran & GCC countries for efficient spectrum utilization and minimized interference in 2.6 GHz and 3.5GHz.
Zain’s Regulatory Agenda

Lowering of spectrum costs for new acquisitions and license renewals

Grant Longer License Duration in line with international best practice (>20 years)

Guarantee technology neutrality across all bands

Favorable Payment Models: Installment over license tenure; deferred payment schemes

Accelerated release of IMT spectrum in markets with limited spectrum holdings

Regulator-led cross border frequency & synchronisation coordination across all bands

Apply light-licensing regime to E-Band Spectrum for Microwave Backhaul

Proactive Publication of National Spectrum Roadmap for Coordinated Planning
-

Infrastructure and Climate Action
Infrastructure and Climate Action
- Service Licences
- Sites/Masts/Active/Passive Sharing/TowerCo
- National/Intercity/Metro Fibre/Open Access
- International Connectivity/Submarine Cables
- Data Centres/Cable Landing Stations
A green energy agreement was signed in Jordan in 2023 – supporting climate action initiatives. Other notable infrastructure-related initiatives included backhaul cost reduction in Bahrain, the receipt of approvals for submarine cable deployments in Saudi Arabia, approval of a cable landing station in Sudan, and the institution of a new ministerial regulation imposing a 20m minimum site-residential building separation in Kuwait.
Infrastructure Sharing
Jordan
- Agreement signed between Zain and the Electric Power companies (JEPCO, EDCO, NEPCO) to provide Zain with green energy
Bahrain
- Based on NTP-5 mandate, ongoing negotiations on the fiber assets transfer with BNET with right-ofuse as model.
- In 2023 Zain secured a 25% backhaul costs reduction with further reductions discussion ongoing.
International Gateway
South Sudan
- The IGW management is now officially under the NCA following Q2 2023 restructuring.
- Nationwide fiber deployment by Moya the 2nd provider. Presence of an alternative provider is beneficial to Zain for core network connectivity.
Sites deployment
Kuwait
- Ministerial decision No 003/2024 limits the distance between communications towers and certain types of buildings to 20m.
- Joint lobbying effort with GSMA ongoing to remove compliance distance.
Submarine Cable Approvals
Saudi Arabia
- Blue Raman project awaiting additional documentation and information from Zain after CST approval.
- PEACE Cable roll-out underway with no further regulatory hurdles.
Sudan
- Final approvals for Africa-1 submarine cable landing station were successfully secured.
- Environmental survey and some other minor approvals (localities and power authorities). are ongoing.
- Positive contribution to revenue increase as Zain is permitted to sell capacity to 3rd parties and capacity cost reduction.
Zain’s Regulatory Agenda

Support right to deploy fibre or regulated access to fibre on fair price and non-price terns

Liberalisation of international gateway and cable landing stations

To lower IP transit costs, advocate landing of more submarine cables

Favourable legislation for passive/active infrastructure sharing & TowerCo establishment

Offer unified or integrated licences to permitting fixed and mobile services for converged offerings

Accelerate initiatives to support digital infrastructure: Data centres, IXPs, etc.

Site roll-out regulations aligned to international best practices

Favourable legislation for renewable energy generation / production
-

Industry Taxation and Levies
Industry Taxation and Levies
- Operator Regulatory Fees
- Consumer Levies
- Value Added Taxation
- Universal Service Fees
- Tracking of Regulatory Financial KPIs
Notable developments include receipt of KWD 24 million, representing the court-mandated claims for numbering fee overpayment and increased tower and site rental fees in Kuwait, an increase of annual license fee in Bahrain (now 2%) and a new corporate tax in the UAE.
Regulatory fees
Kuwait
- Refund claims of numbering fee overpayment filed by Zain related to their allocated/reserved number ranges before August 2011 against MoC and CITRA after April 2017 court decision invalidating part of the regulatory tariff decree No. 126 / 2011.
- Process took almost 6 years.
- Zain received the claimed amount of KD 24.680m in Q4 2023.
- Tower and Sites Regulation: Objection filed against Rental fee increase by several government bodies (MOF, PAI, CITRA)
- Financial impact.
United Arab Emirates
- A new Tax Law on companies was introduced in the UAE by Federal Decree Law No.47 of 2022. Implementing Regulations of this Law were issued based on several Cabinet Decrees and Ministerial decrees.
- Financial impact is a 9% corporate tax rate on annual taxable incomes over AED 375,000.
Bahrain
- Telecom Law amendment raises annual license fee cap to 2% and Schedule of Fees regulation to be amended accordingly from 1st Jan 2024.
South Sudan
- MNOs are lobbying for tariff adjustment approval by NCA as necessary as the Market exchange rate has reached SSP1150 : USD 1 with the NCA exchange rate currently at SSP 618.75 : USD 1
- USD 2 one-off import tax implemented for new SIM cards.
Zain’s Regulatory Agenda

Lower levels of industry-specific fees (revenue share, licensing, numbering) on national operators

Where possible, eliminate industry-specific utility prices or differential tax rates

Create incentive to deploy IoT/M2M by lowering regulatory costs to enable these to thrive

Lower Government-imposed activation charges on customers (SIM, connection taxes)

Lower handsets taxes to enhance affordability

Lower Usage Taxes (excise duties, higher VAT rates.…)

Reasonable rental fees for passive infrastructure owned by government entities.

Minimal or no fee that will hinder digital services development
-

Competition and Market Developments
Competition and Market Developments
- Strategic Market Reviews and Remedies
- Access & Interconnection
- Competition Matters
- Telecom Law Reviews
- Others: New Entrants/OTT Players
These include, among others, the announcement of the fourth mobile license in Iraq, the cost modelling (LRIC) projects in Jordan and Kuwait with implications on wholesale and retail prices, and an initiative to reduce international capacity prices in Kuwait.
Market Developments
Iraq
- 4th License: The Cabinet approved to grant a national license (the 4th license) with 3 years 5G mobile technology (5G) exclusivity to Al-Salam General Company (subsidiary of the MoC)
- Korek:Parliament approved license revocation for non-paying MNOs by EOY 2023. On 1st of Nov 2023, the CMC sent a letter to Zain and Asiacell to disconnect the Interconnection with Korek
- MVNO: CMC issued a MVNO Regulation.
Sudan
- In Sep 2023, Zain secured another 25% prices increase across all services from the TPRA.
- The increase is due those two factors a) Forex and b) inflation rates increases.
South Sudan
- Implementation feedback requested on East Africa One Network Area (ONA) roaming agreement by NCA
- As ONA terms considered not operative by MNOs.
Kuwait
- Long Run Incremental Cost (LRIC) Exercise completed. Results could set retail price floor.
- Public consultation to reduce current high tariffs of Leased Circuits (IPLC) via submarine cables
- Fixed Network Development Project: MOC seeks an Intl operator to manage the fixed network.
- Zain launched a partnership with RedBull.
Saudi Arabia
- Zain is challenging CST decision that providers must ensure delivering 70% of the advertised speed instead of the current 50%.
- Court case against CST regarding coverage and speed commitments lost by Zain, STC, and Mobily. Appeal pending at supreme court.
Bahrain
- The National Telecom Plan (NTP6) was issued, advocating Smart Kingdom’s objective and targeting a recognition of being top 10 regionally and worldwide.
- Zain Participated in key TRA initiatives on unified licensing, AI, data privacy, BNET review and consumer protection.
Jordan
- Based on the TSLRIC+ efficient operator model, the TRC set the MTR at 0.21 fils/min with a glide path starting from 2 fils/min in 2023 and SMS termination at 0.22 fils/SMS to be implemented as a flat rate across 2024-2027.
- Zain is working towards the increase of proposed rates as they will negatively impact the interconnection revenues as well as the Bulk SMS revenue
United Arab Emirates
- Introduction of FedNet an on-demand network access to a shared pool of configurable computing resources for all federal government entities.
- Main feature is its secure MPLS Cloud based architecture that enhances UAE’s cybersecurity.
Zain’s Regulatory Agenda

Periodic Strategic market reviews to assess effectiveness of any ex-ante obligations

Avoid stringent regulations or government behavior that impede competition (e.g monopolies)

Implement proportionate remedies – only apply tariff pre-approvals on dominant operators

Market liberalisation should consider ability of existing players to sustain and recoup investments

Lobby for Retail Tariff increase when inflation rates and Forex are out of normalcy

Ensure Cost-based pricing for Wholesale and access services

Implement regulations addressing price wars that destroy market value

Regulate number of MNOs/MVNOs to a level that does not deter further investment
-

Customer Affairs and Data Protection
Customer Affairs and Data Protection
- Personal Data Protection and Privacy Consumer Protection
- SIM-Registration / SIM-Caps
- Customer Complaints Handling
- Others: Billing / Collection / Spam
Several developments have occurred in Bahrain, Jordan, Kuwait, Saudi Arabia, and the UAE.
Personal Data Protection (PDPL)
Saudi Arabia
- The amendments to the Personal Data Protection Law (PDPL) in Saudi Arabia were officially made pursuant to Royal Decree No. M/148, dated 27 March 2023.
- Zain proactively complying with the Personal Data Protection Law (PDPL) ahead of the 1-year grace period ending September 14, 2024.
Kuwait
- CITRA issued an update to the Data Protection and Privacy Regulation. The new regulation, Resolution No. 26 of 2024, was issued in Q1 2024.
Jordan
- On 30 Aug. 2023, the Parliament approved the Law on Personal Data Protection.
- Entities under Central Bank can process, transfer, exchange data within or outside Jordan without informing concerned person.
- No licenses/permits required for entities processing data for the purpose it has been collected if no publishment or disclosure to 3rd parties
United Arab Emirates
- The UAE’s first federal data protection law, Federal Decree-Law No. 45 of 2021 on Protection of Personal Data took effect on January 2, 2022. This law applies to any data subject who resides in or has a place of business in the UAE, any firm processing personal data inside or outside the UAE as a controller or processor, and any firm located outside the UAE that processes data inside the UAE.
- The UAE’s Telecommunications and Digital Government Regulatory Authority introduced the ‘UAE Information Assurance Regulation’ to enhance information security against evolving cyber threats, ensuring a trusted digital environment by establishing robust controls for managing, processing, storing, and transmitting information.
Zain’s Regulatory Agenda

Enact consumer protection legislation to guard against unfair terms and foster transparency

Create a safer internet experience for consumers, businesses and society

Develop Robust Standalone Data Protection Laws Across All Sectors

Create flexible and reasonable SIM Registration Requirements

Develop legislation enabling the use of artificial intelligence without impeding personal data protection,

Promote transparency in Customer Privacy Information collection and use by 3rd parties

Avoid onerous consumer protection rules impeding operators’ marketing strategy

Create light touch or favourable roaming regulations governing usage, price, price caps and terms
-

5G
5G
- 5G Policy Development
- 5G Licensing Rollout Obligations
- Strategic Approach to Verticals
- 5G Security and Privacy
- Demand Stimulation for Use Cases
These cover the launch of 5G in Jordan and the grant of three years of 5G exclusivity in Iraq for a fourth mobile licensee.
5G Developments
Iraq Risk of Early Launch:
- Officially there is no 5G plan from CMC except the 3-year 5G exclusivity given to the 4th mobile licensee.
- A letter has been sent from CMC to all vendors in Iraq prohibiting them from providing 5G equipment, consulting on 5G, supporting operation of 5G network in Iraq except to the 4th mobile licensee. All vendors have accepted their adherence to the CMC instructions.”
Jordan
- Zain was granted 100MHz 5G Spectrum Licence in the 3700-3800 MHz band in Q1 2023.
- Zain launched 5G in Q4 2023 starting with 5G home router services
United Arab Emirates
- Nokia have successfully concluded the UAE’s first 5G-Advanced 5G Reduced Capability (RedCap) trial over a commercial network.
Zain’s Regulatory Agenda

Ensure 5G rollout obligations are not onerous
Government-led 5G investment support in exchange for accelerated rollout of 5G

Licensed spectrum dedicated to MNOs and not to Verticals

Government to stimulate 5G demand and cross sector collaboration to support use-cases

Collaborative actions to tackle 5G Security Challenges that Service Providers are facing.

Promote the development of private 5G-network-as-a-service provided by MNOs

Release new spectrum for 5G to drive bandwidth availability for advanced use cases

Promote fiber roll-out for speedy 5G backhauling and effectiveness
-

B2B, Cloud, IoT and ICT Focus Areas
B2B, Cloud, IoT and ICT Focus Areas
- B2B Enablement
- IoT Regulatory Framework
- A message for drones
- Cloud Computing Frameworks
- Cyber-security regulatory mandates
Notably, the issuance and update of IoT regulations and related topics in Iraq, Jordan, Kuwait and the UAE.
B2B, IoT and Cloud
Iraq
- In May 2023, the Iraqi Communications and Media Commission (CMC) issued its Draft Cloud Computing Policy, draft Drone regulation for consultation.
- The Policy highlights registration/licensing requirements and various obligations on CSPs.
United Arab Emirates
- Decree No.9 of 2023 from the TDRA that outlines the Licensing regulations for Licenses issued by the TDRA which includes the Internet of Things License.
- Some provisions of the Drone Law of Dubai (Law No.4 of 2020) have been amended through Law No.10 of 2023. The amendments were mainly related to the Licensing requirement for the use of Unmanned Aerial Vehicles in Dubai.
- Decision No.20 of 2023 from the Dubai Civil Aviation Authority outlining the Licensing requirements of Unmanned Aerial Vehicles in Dubai
Kuwait
- CITRA issued a draft IoT regulatory framework in June 2023
- Main points being addressed by MNOs include technology neutrality, numbering/addressing fees minimal or zero.
- Final version is yet to be published.
Jordan
- The modified IoT instructions (4-12/2023 issued in 2020 and amended in 2021) have been approved in Dec 2023.
- No major changes from the consultations and the previous version.
- Prior approval is still required to provide IoT services.
Zain’s Regulatory Agenda

Lobby for Unified Licenses or Right to Offer Fixed/Data Centre Services

Accelerate adoption of Cloud regulations through favourable legislation

Permit cross-border transfer of non-personal data for centralized processing

Create favourable regulatory frameworks to IoT/M2M deployment and service provision

Lobby for incentives and subsidies to attract investment to boost Datacenters capacity

Develop cybersecurity legislation to prevent attacks and secure applications and infrastructure

Incorporate balanced regulations, supportive of data protection and Big data analytics development

Create favorable regulations and alignment amongst authorities for the civil use of unmanned aircraft (drones)
-

Innovative Digital and Emerging Services
Innovative Digital and Emerging Services
- Artificial Intelligence
- Digital On-Boarding/Electronic Transaction Laws
- FinTech/Insurtech/e-Payments Regulations
- AML/CFT Laws and Regulations
- Digital Content / E-Sports
In Saudi Arabia, CST issued Digital Content Regulations to regulate content players. In Iraq, CMC launched public consultations on Applications and Digital Content Platforms with the risk of revenue share imposition.
Innovative Digital Services
Iraq
- In Sep 2023, the CMC issued 2 public consultations: a) Digital Application Regulation and b) Digital Content Platform.
- The main issue is the imposition of an 8 % new revenue share on Digital Services.
- CMC and CBI are currently engaged in discussions regarding the facilitation of electronic payments with the aim of finding a solution that enables operators to continue offering digital services through direct operator billing.
Saudi Arabia
- In Oct 2023, CST issued the Regulations for providing digital content platform services.
- Aims to promote fair competition among digital content platforms, protect users and businesses from unfair and anti-competitive practices, and promote certainty and consistency for all actors engaged in the digital content sector.
Zain’s Regulatory Agenda

Develop policies and legislation supportive of Artificial intelligence adoption.

Accelerate adoption of e-KYC and e-Authentication procedures

Enactment of laws – e-commerce, payment – which are supportive of FinTech growth

Enactment of laws and regulations which are supportive of digital health

Enforcement of electronic contracts and signatures in judicial system

Lobby for legislation that promotes the usage of direct operator billing by operators

Enactment of legislation which is supportive of e-gaming growth and development

Promote creation of regulatory sandboxes for emerging technologies
HOW TO PLAY ?
Zain manages regulatory matters at the Group and the operating company level with robust internal controls implemented across business jurisdictions. The Group leads Group-wide impact initiatives, while individual markets manage and monitor developments locally.
Group Regulatory Initiatives
Regulatory Compliance Program
In 2022, Zain initiated a significant endeavor to implement the Regulatory Compliance Program (RCP), making notable progress in establishing a regulatory compliance culture within the organization. In Phase I, the RCP was deployed at the Group and in Zain Bahrain. In Phase II (commenced in 2023), the RCP was extended to Zain Kuwait and Zain Iraq. In addition, a compliance status assessment was conducted in Zain Bahrain to track adherence and proactively identify any risks. Going forward, the upcoming Phase III will see the implementation of RCP in Zain Sudan, Saudi Arabia, and Jordan in 2024. To ensure continuous compliance with internal controls, governance, monitoring, and risk-prioritized resolution aspects of the program, in alignment with ISO 37301, the ongoing management of RCP will be assured through regular updates to the compliance register and RCP portal.
Operating Market Regulatory Developments
In 2023, critical developments took place in Zain’s operating markets across Zain’s eight regulatory focus areas:
- Spectrum & Technical regulations – The finalization of the frequency spectrum license auction in 1800 MHz in Sudan and the grant of 1800 MHz and 2100 MHz spectrum, following the conclusion of the settlement agreement in Jordan, represented vital achievements. A significant development was finalizing the cross-border agreement between Iran and GCC countries for efficient spectrum utilization and minimization of interference in 2.6 GHz and 3.5G Hz bands.
- Infrastructure & Climate Action – A green energy agreement was signed in Jordan in 2023 – supporting climate action initiatives. Other notable infrastructure-related initiatives included backhaul cost reduction in Bahrain, the receipt of approvals for submarine cable deployments in Saudi Arabia, approval of a cable landing station in Sudan, and the institution of a new ministerial regulation imposing a 20m minimum site-residential building separation in Kuwait.
- Industry taxation and levies – Notable developments include receipt of KWD 24 million, representing the court-mandated claims for numbering fee overpayment and increased tower and site rental fees in Kuwait, an increase of annual license fee in Bahrain (now 2%) and a new corporate tax in the UAE.
- Competition and market developments – These include, among others, the announcement of the fourth mobile license in Iraq, the cost modelling (LRIC) projects in Jordan and Kuwait with implications on wholesale and retail prices, and an initiative to reduce international capacity prices in Kuwait.
- Customer Affairs and Data Protection – Several developments have occurred in Bahrain, Jordan, Kuwait, Saudi Arabia, and the UAE.
- 5G – These cover the launch of 5G in Jordan and the grant of three years of 5G exclusivity in Iraq for a fourth mobile licensee.
- B2B, Cloud, IoT and ICT Focus Areas – Notably, the issuance and update of IoT regulations and related topics in Iraq, Jordan, Kuwait and the UAE.
- Innovative Digital and Emerging Services – In Saudi Arabia, CST issued Digital Content Regulations to regulate content players. In Iraq, CMC launched public consultations on Applications and Digital Content Platforms with the risk of revenue share imposition.
Zain’s Regulatory Agenda
Zain’s regulatory strategy and advocacy plan are designed solely to support the implementation and realisation of the objectives of Zain’s 4Sight corporate strategy. The key messages reflect Zain’s positions conveyed through direct engagement with regulatory authorities and responses to public consultations. Zain continues to work closely with advocacy bodies such as GSMA, SAMENA Telecommunications Council, and other industry bodies to advance these positions with regulatory bodies and other government stakeholders.

RISK MANAGEMENT
Zain operates in a highly regulated, competitive, and rapidly evolving environment. This landscape is growing more complex due to the strategic focus to grow adjacent businesses and the significant investment to maximize returns from the digital economy. Additionally, the global outlook deteriorated significantly in 2023 with the rise in central bank rates leading to decline in consumer spending.
The unprecedented uncertainties in the external environment meant that the Group’s risk landscape evolved – as shown in the Risks That Matter section – and, similarly, the Group’s approach to governance and risk management was adjusted.
Safeguarding our business through three lines of defense
Zain Group’s Enterprise Risk Management (ERM) function plays a critical role within the company, reporting to the Board Risk Committee (BRC), which meets quarterly to discuss the risk profile of the organization. The BRC oversees the implementation of a strategic risk assessment exercise across Zain’s operations, while also reviewing and approving the risk management framework on an annual basis.
In addition, the BRC oversees compliance with risk management policies and procedures, and reviews the adequacy of the risk management framework in relation to the risks faced by the organization, from operational risk management, cybersecurity, and operational resilience
Management remains ultimately responsible for ensuring the adequacy and effectiveness of the Group’s control environment, thereby limiting the likelihood of risks materializing that could exceed the approved appetite. The ERM function, through the existing governance structures, assists management by monitoring the implementation of effective risk management practices across the Group. Finally, Internal Audit provides independent and objective assurance to management and the Board on the adequacy of risk management and the effectiveness of the control environment and, through their mandate, facilitates the continuous improvement of the Group’s governance practices.
Three Lines of Defense
| First Line | Second Line | Third Line |
|---|---|---|
| Management (Risk Owners) 1- Own and manage risks 2- Implement the response strategies 3- Periodical monitoring and reporting | ERM Implement and operationalize the ERM framework, promote risk aware culture, provide support to management and challenge on risk | Internal Audit Act in accordance with recognized international standards for independent assurance of first and second lines |
The Group’s ERM function performs a pivotal role in ensuring the resilience of our strategic plans and operations, including but not limited to the following activities:
- Periodically scanning the environment to ensure that we maintain an up-to-date view of the key risks that may impact us at a macro level, and provide those views to management on a regular basis at various engagement points, including through reporting to BRC.
- Engaging with our community of risk professionals, risk champions and ERM teams in many of our operating entities and international subsidiaries, providing them with the right tools and training, and supporting them to achieve their objectives and continuously raise the bar in terms of the quality of risk management practices across the Group.
Risks That Matter
In accordance with our risk management process, we continually scan, assess, and monitor the Group’s risk and control environment, thereby proactively seeking to reduce risk exposures down to acceptable levels. In line with this process, the following summarizes several of our risks and describes the high-level approach to managing them.
-
Description
As we operate in diverse markets, we face legal and regulatory challenges. The authorities can alter current regulations and implement new ones, which can significantly influence our operations and financial performance.
-
Impact
Increased cost of operations (license fees, cost of regulatory compliance) leading to reduced profits, delay, or postponement in launch of new businesses and services to create new revenue streams.
-
Mitigation
Collaborate with market regulatory authorities and other stakeholders, engaging in market issues, with a clear focus on common benefits.
Innovation on new products and services to enhance revenues and overcome increased regulatory costs.
-
Description
Zain operates in multiple markets, and changes to macro-economic indicators impact operations significantly.
Geopolitical hindrances lead to reduced access to capital and technology.
Political unrest causes disruption to operations.
-
Impact
Reduced customer spending leads to reduced revenues impacting the execution of the company’s strategy.
Weakening local currencies in certain subsidiaries affects the profitability of Zain’s operations and asset valuation.
Hike in interest rates have increased the cost of debt in certain subsidiaries.
-
Mitigation
Ensure cost optimization initiatives and access to longand short-term capital options through varied sources of funding. Employ various hedging instruments to offset rate hike impact.
Ongoing improvement of our business continuity capabilities across operations.
-
Description
As technologies advance rapidly, cybersecurity threats are also evolving and need continuous monitoring.
-
Impact
Customer data breach, financial, reputational, or regulatory consequences.
-
Mitigation
Ongoing enhancement of our cybersecurity capabilities by updating:
- Periodic assessments
- Latest security tools
- Training and awareness programs.
-
Description
Billing and charging systems are a critical core of our business. The systems are being transformed in certain operations to offer attractive packages along with value added services.
-
Impact
Delayed and incorrect implementation of the systems may lead to customer churn and cost overruns.
-
Mitigation
Formation of a dedicated crossfunctional transformation team for planning and delivery of transformation programs. Develop transformation KPIs for the program and associated stakeholders
-
Description
Digital transformation strategies require transformation of workforce capability and skills, as talent acquisition needs are pronounced in domains such as machine learning, data science, AI, and software-based networks.
-
Impact
Business initiatives leveraging digital platforms and new skillsets will be affected, leading to disruption to the digital transformation program.
-
Mitigation
Re-structuring organizational structure to align with a digital future while maintaining an effective balance between external hires, contractors, and internal re-skilling program. Initiatives to attract digital/tech talent by creating a compelling value proposition for prospective talent.
Technology

The Zain Brand
An admired brand focused on delighting customers
Zain’s brand value and position as one of the most powerful and admired telecom brand entities in the region continues to grow, bolstered by Zain’s neverending widespread awareness and tactical campaigns covering digital innovation, corporate sustainability, and eye-catching marketing and social media campaigns that captured the region’s imagination.
17 years after the Zain brand was originally launched in 2007, the brand’s valuation has consistently grown, with the 2023 valuation growing 14% from US$2.4 billion to US$2.74 billion, according to the BrandFinance 2023 Global Telecom and Middle East brands report. This valuation and brand rating of AA+ maintains Zain’s position as the unrivaled number one home grown brand from Kuwait and one of the region’s most loved and recognizable brands.
This brand valuation milestone is a testament to our unwavering dedication to crafting a commanding brand identity that stands as a beacon, illuminating not only our success but also the profound resonance of the Zain brand in the consciousness of consumers, firmly establishing Zain as a formidable force in many industries.
Shrewd implementation of the company’s 4Sight strategy is driving digital transformation across all operations resulting in the rollout of quality mobile and data services, emerging technologies and enhanced network capabilities including 5G. This empowers Zain to offer compelling products and service that extend beyond telecom into a vast array of digital services, content, entertainment, fintech, home automation, esports, cloud, artificial intelligence, cybersecurity, smart cities, drones and robotics.
As Zain, our commitment to creating a wonderful world is to lift the barriers to innovation through the introduction of digital services that will allow governments, businesses, and individuals within our operating areas to streamline their operations, increase their digital footprint, and reach heightened levels of success.
However, creating a wonderful world means much more than the introduction or expansion of cutting-edge technologies. It is an active global vision created to uplift all the lives we touch far beyond increasing their ease of access to the digital world.
Zain will continue to develop its brand equity by investing in operations, technology, innovation, marketing and customer experience. The company’s numerous initiatives across operations have all contributed to the reinforcement of the Zain brand’s promise and business ethos. The company seeks to unlock opportunities for customers and for the communities it serves, remaining committed to the region’s economic and social prosperity.
Captivating marketing campaigns
Complementing multiple creative campaigns across its footprint, capturing the hearts and minds of the region, every Ramadan, Zain presents a new message that touches upon the most relevant issues in life in its television commercials to the region’s substantial Ramadan audience.
The 2023 Ramadan and Eid television achieved over 100 million views on YouTube alone. Apart from employing the best talent to produce its commercials, Zain partners with and utilizes the best creative digital agencies across the region to ensure its brand is widely seen and appreciated.
Social media: promoting the brand to 23 million followers
Zain’s relentless focus on promoting its brand creativity and messaging, corporate sustainability, and activities across its markets and the wider region through social media channels resulted in an impressive increase in followers, engagement, and views across social media channels.
Social media teams across Zain’s footprint regularly produce appealing and engaging content, consumed by responsive followers. This has resulted in a loyal social media base across the Zain footprint, numbering over 23 million, with 13 million fans on Facebook, more than 8 million followers on Twitter, 3 million on Instagram, and 800,000 on LinkedIn. Annually, Zain Group and its operations’ YouTube channels receive more than 250 million views.
The Ramadan 2023 Television Commercial

The message behind this television commercial, “Psychological tremors” was to raise awareness about the impacts we face mentally and their effect on people that are comparable to physical tremors. The overarching message was to be compassionate to your fellow humans and to be considerate and kind towards them. It was viewed by over 20 million across various platforms, plus shown on various major satellite TV channels watched by millions.
The Eid 2023 Television Commercial

Eid’s television commercial, “Welcome Eid” was a cultural touchstone that transcends conventional advertising, it was revolutionary featuring a hologram of Abdel Halim Hafez, a first for the genre. The jubilant and positive tone of this TVC projected positivity and celebration for a wonderful time of year, Eid Al Fitr. This masterpiece garnered over 70+ million organic views on YouTube, transforming it into a cultural phenomenon.
The Zain annual play

Zain’s annual play “Nothing Like Zain” during the EID al Fitr period soared with its groundbreaking, inclusive design, a meticulously crafted three-tier stage. Beyond captivating 55,000+ attendees, it added depth to the narrative, showcasing Zain’s commitment to pushing creative boundaries. Inclusivity played a pivotal role, setting Zain’s play apart. Sign language interpretation in the recorded version boldly demonstrated dedication to accessibility, resonating globally with English subtitles extending impact. Zain’s Play achieved universal acclaim, with record-breaking attendance reflecting its innovative storytelling, solidifying Zain’s leadership in creative expression.
A multiple award-winning brand
Zain’s multiple initiatives contributed to the overall increase of the company’s brand equity and accordingly, Zain Group and its operations received numerous prestigious awards during 2023.
-

Zain maintains leadership position of A- in ‘CDP Score Report–Climate Change 2022′ and attains A- score on the Supplier Engagement rating
-

Zain wins two distinguished awards in Sustainability and Women’s Empowerment
-
Zain wins two ‘Best Corporate Governance in Kuwait’ awards from World Finance and the Arab Federation of Capital Markets
-
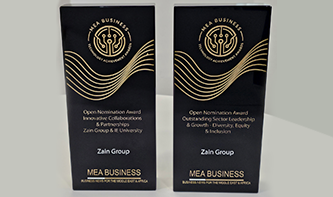
Zain’s Diversity, Equity & Inclusion (DEI) program acknowledged with two awards at the Samena Council endorsed MEA Business Achievement Awards
-

Zain ranks in the Leader tier (8.4/10) in Global Child Forum’s ‘The State of Children’s Rights and Business 2023’ Benchmark
-
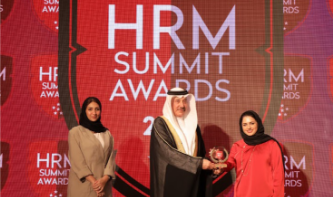
Zain Bahrain Won the HRM 2023 Summit & Awards under the ‘Best Wellness Program’ Category
-

Zain Jordan won the Hussein bin Abdullah II Award for its contributions to education and training
-
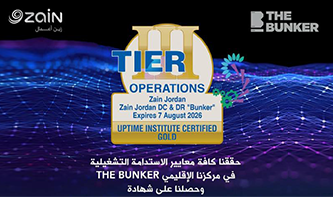
Zain Jordan’s data center facility, The Bunker, has won the prestigious Tier III Gold Certification for Operational Sustainability from Uptime Institute®
-
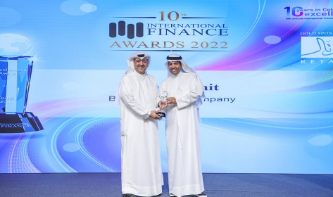
Zain ‘Best Telecom Company’ and ‘Best Digital Transformation Telecom Company’ in Kuwait 2022
-
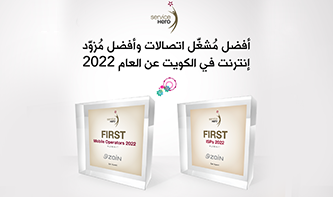
Zain ‘Best Mobile Operator’ and ‘Best ISP’ in Kuwait during 2022
-

Zain Great Idea recognized as ‘Ecosystem Enabler of the Year’ for the region
-
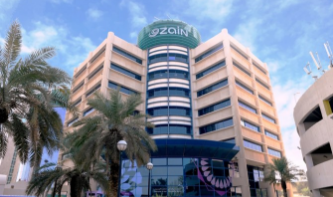
Zain wins ‘Outstanding 5G Business Development’ award during SAMENA Council’s prestigious LEAD awards in Dubai
-
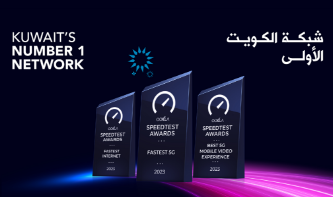
Zain first and only operator in Kuwait to win three major awards from Ookla® Speedtest®: Fastest 5G, Best 5G Video Experience, and Fastest Internet
-

Zain KSA’s Yaqoot digital service received two awards from the prestigious Mobile Marketing Association “MMA SMARTIES” in the Marketing Impact and Experience Technology categories. -
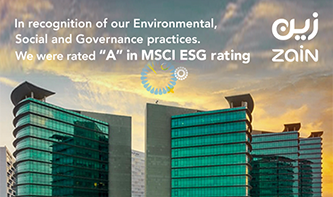
Zain KSA’s MSCI ESG Index Rating Upgraded to ‘A’, in recognition of remarkable Environmental, Social and Governance efforts -

Zain KSA wins three awards at the TR Leaders’ Summit 2023, ‘Best Diversity and Inclusion Program’, ‘Best Green Technology’, in recognition of launching the first zero-emission 5G network worldwide, and ‘Global Merit Leader – Women in ICT of the Year’ -
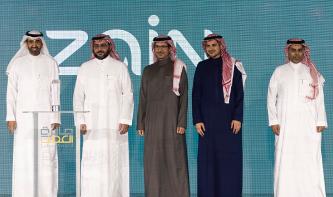
Zain KSA earned the prestigious HRSD ‘Labor Award’ and securing its position as a national ICT leader announced during the Global Labor Market Conference (GLMC)
Social media: promoting the brand to 23 million followers
Zain’s relentless focus on promoting its brand creativity and messaging, corporate sustainability, and activities across its markets and the wider region through social media channels resulted in an impressive increase in followers, engagement, and views across social media channels.
Social media teams across Zain’s footprint regularly produce appealing and engaging content, consumed by responsive followers. This has resulted in a loyal social media base across the Zain footprint, numbering over 23 million, with 13 million fans on Facebook, more than 8 million followers on Twitter, 3 million on Instagram, and 800,000 on LinkedIn. Annually, Zain Group and its operations’ YouTube channels receive more than 250 million views.
ZainTECH: Transforming tomorrow today
2023 marked a pivotal year for ZainTECH as the company celebrated its third year of operation with a robust year-on-year revenue growth, reflecting its commitment to delivering exceptional services and solutions in a sustainable manner.
ZainTECH’s mission extended beyond mere service provision; it spearheaded the transformation of enterprise and government entities across the MENA region. With a focus on excellence and innovation, the company delivered managed solutions spanning cloud computing, cybersecurity, AI & big data, digital solutions, and drones & robotics.
The year witnessed a significant expansion of the ZainTECH team, with over 750 dedicated ICT professionals now serving an expanding clientele across eight MENA countries and diverse sectors, including Telco, Government, Oil & Gas, Retail, and Financial Services.
Furthermore, 2023 saw ZainTECH’s commitment to growth manifest through both organic expansions and strategic collaborations with technology partners. By continually enriching its offerings and fostering alliances, the company ensured its clients had access to the most advanced products and services.
ZainTECH also embarked on an exciting growth phase through strategic acquisitions, adding significant value to its portfolio while harnessing the unique competencies and market insights of acquired entities. These endeavors not only bolstered its capabilities but also reinforced its position as a leader in the industry, poised to drive impactful change across the region.
Expanding Horizons: ZainTECH shines at GITEX Global
Unveiling of a New ICT Hub
Accelerating Growth Through Strategic Acquisitions
Building a Thriving Partnership Ecosystem
Industry recognition
Outlook
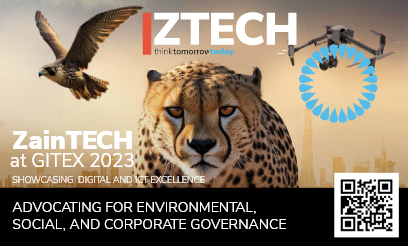


Cementing its position as one of the most robust enterprise services ecosystem builders in the region, ZainTECH used its inaugural participation at GITEX Global 2023 to showcase its cutting-edge portfolio of products and digital solutions. The company made a strong impact with its offerings spanning cloud computing, cybersecurity, artificial intelligence (AI), data services, digital solutions, and the innovative fields of drones and robotics. From pipe inspection robots to roving four-legged “anymal”, ZainTECH demos generated significant interest from the visiting public. In line with its steadfast commitment to sustainability, ZainTECH’s 300 sqm two-level exhibition stand was constructed using recycled materials, with a keen focus on components designed for reuse. This ecofriendly approach not only underscored the company’s dedication to environmental stewardship but also added a modern and sleek aesthetic to the stand, serving as the perfect backdrop for a series of captivating demonstrations.
Closing the year on a high note, ZainTECH announced a substantial investment initiative marking the establishment of its state-of-the-art Information and Communication Technology (ICT) Hub and the expansion of its operations at Dubai Internet City, the region’s leading community for technology and digital transformation. The strategic move further positioned ZainTECH at the forefront of digital transformation in the region and will help the company serve its growing customer base.
Spanning over 13,000 square feet, the ICT hub will act as an operational center of excellence and drive technological initiatives and synergies across business units. Hosting over 300 employees, the UAE ICT hub will foster continuous learning and dynamic collaboration across Zain’s regional footprint.
Equipped with a state-of-the-art Network Operation Centre (NOC), the cutting-edge hub strategically supports ZainTECH’s expansive cloud infrastructure across the GCC, providing seamless access to premium support for over 500 customers. Furthermore, the facility boasts a newly established Security Operating Centre (SOC) – the fourth in ZainTECH’s growing regional footprint – dedicated to efficiently detecting and responding to cyber threats, ensuring robust cybersecurity measures for clients. At the heart of the ICT hub lies the Experience Centre, designed to offer customers an immersive and personalized environment, showcasing several live demos and the company’s expertise in internetof-things (IoT), drones, robotics, and data solutions. Emphasizing sustainability, a core focus for Zain Group, the ICT hub incorporates energy-efficient technologies and advanced waste-reduction mechanisms.
In a strategic move aimed at fortifying its market presence and enhancing its service offerings, ZainTECH initiated a series of significant acquisitions in 2023. These acquisitions underscore the company’s commitment to expansion, innovation, and maintaining a competitive edge in the dynamic digital solutions landscape.
During GITEX Global 2023, ZainTECH announced the acquisition of Specialized Technical Services Company (STS), Jordan’s largest digital transformation solutions company, with operations in Saudi Arabia, the United Arab Emirates (UAE), Bahrain, and Iraq. This strategic move not only expanded ZainTECH’s service spectrum but also bolstered its market presence, facilitated access to top-tier talent, fostered innovation, and fortified its competitive stance across the Middle East.
ZainTECH also spent the year consolidating its transaction pipeline, which included closing the acquisition of BIOS Middle East, a regional managed secure cloud provider with a presence in the UAE, Saudi Arabia, and Oman, as well as Adfolks, a UAEbased cloud-native engineering firm that provides a comprehensive range of cloud transformation services and possesses proven expertise in modern infrastructure, application modernization, security, data and machine learning, and automation. These acquisitions further solidified ZainTECH’s position as a frontrunner in delivering comprehensive digital transformation services and expertise.
One of the pillars of ZainTECH is partnerships. The company collaborates with the leading global technology players to deliver solutions suited to its clients’ needs. Building on the foundation of its existing long-standing partnerships with industry leaders such as Microsoft, Oracle, VMware, Amazon Web Services, Cisco and more, ZainTECH expanded its network of partnerships in 2023.
Throughout 2023, ZainTECH announced a series of technology agreements and strategic alliances reflecting its commitment to partnering with the best technology providers in the business to provide its clients with the most advanced array of products and solutions:
du, from Emirates Integrated Telecommunications Company (EITC) and ZainTECH, announced a strategic go-to-market partnership aimed at unlocking synergies while embracing ESG principles towards a Net Zero future. This collaboration offers enterprise customers innovative solutions spanning Sustainability (IoT), Drones-as-a-Service (DaaS), Data Practice, Cloud Managed Services, App Modernization, as well as international connectivity.
Mastercard and ZainTECH entered a memorandum of understanding (MoU) to create unique data-driven and innovative solutions for businesses across the Middle East and North Africa (MENA). This partnership streamlines operations, enhancing productivity and cost savings for clients.
Disrupt-X is a UAE-based Internet of Things (IoT) company renowned for its end-to-end full-stack Digital Solutions offerings, , ZainTECH will partner Disrupt-X to expand its IoT capabilities empowering governments and enterprises to streamline operations efficiently, leveraging advanced data analytics to gain deeper insights and make informed decisions in today’s rapidly evolving digital landscape.

FICO, a New York Stock Exchange-listed global analytics software provider, partnered with ZainTECH to accelerate AI and advanced analytics adoption across the Middle East. This collaboration will see ZainTECH expand its reach into new industries in the domains of data science & analytics and digital transformation in the region, including solutions for telecoms, financial services, retail, and power and utilities companies, helping them improve business performance and uncover new revenue streams.

Rochester Institute of Technology (RIT) Dubai to collaborate with ZainTECH in advancing research and development in the UAE, fostering key business collaborations aligned with the national agenda, programs, and talent development. Leveraging this partnership, ZainTECH aims to drive strategic initiatives across national projects, enhancing academic research and innovation culture within the UAE.
Veeam Solutions (Veeam), a leader in Modern Data Protection, teamed up with ZainTECH to deliver Veeampowered Backup as a Service (BaaS) and Disaster Recovery as a Service (DRaaS) offerings. Together, the companies provide customers with comprehensive and cost-effective solutions to scale backup requirements and data management systems.
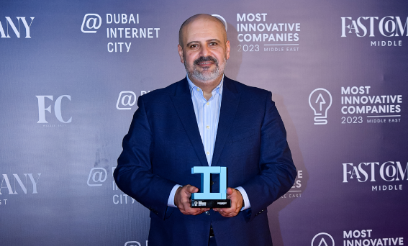
ZainTECH was honored for the second consecutive year as one of the ‘Most Innovative Companies’ in the Enterprise segment for 2023 by Fast Company Middle East for its rapid evolution and leadership in digital transformation through its cutting-edge portfolio of products and digital services. This prestigious award underscores the company’s commitment to simplifying digitalization across the region, offering advisory, professional, and managed solutions across multiple ICT verticals.
2024 is set to be a combination of leveraging the momentum ZainTECH has already established with the opportunities that continue to develop in its markets of operation.
Technology is developing at an extremely fast pace, and enterprises can sometimes become overwhelmed with respect to what technologies and utilization models they need to implement for maximum impact. ZainTECH’s industry-specialized digital advisors and local delivery teams work side-by-side with customers to simplify their digital transformation journeys, ensuring they future-proof their operations and remain competitive.
The demand for ZainTECH’s services is expected to intensify as AI emerges as one of, if not the single most important technological evolution of our time. ZainTECH is incorporating AI in a growing number of solutions to provide customers with the benefits of new opportunities and maximize returns.
The digital transformation trend is firmly established in the region, with ZainTECH anticipating further expansion as national initiatives drive digital societies. The company has strategically positioned itself to capitalize on this trend by continually enhancing its capabilities and relationships.
Zain Omantel International: Revolutionizing the wholesale carrier landscape
In May 2023, an innovative milestone was achieved in the wholesale telecommunications sector with the announcement of Zain Omantel International (ZOI), a joint venture between Zain Group and Omantel. ZOI is leveraging the collective strengths and resources of both Zain and Omantel to create a powerhouse that is not only enhancing operational efficiencies but also delivering cutting-edge, lowlatency, and high-capacity services serving regional operators, international carriers, and global hyperscalers across a vast geographical reach.
The establishment of ZOI is a testament to the strategic vision of Zain and Omantel, marking a significant leap forward in their quest to be a prominent player in the international wholesale telecommunications market.
A Year of Strategic Collaborations and Quick Wins for ZOI
Throughout 2023, ZOI achieved several milestones that underscored its commitment to revolutionizing the wholesale carrier landscape entering strategic partnerships and infrastructure developments that bolstered its service offerings and expanded its footprint:
- Innovation with China Mobile International (CMI): ZOI has entered a groundbreaking partnership with CMI to drive advancements in IoT and IoV across the Middle East. This collaboration is poised to transform the Internet of Things (IoT) and the Internet of Vehicles (IoV) landscape, offering innovative solutions and unlocking new opportunities.
- Collaboration and Infrastructure Developments: Further strengthening its infrastructure, ZOI, in partnership with Sipartech, has made significant strides in enhancing subsea cable landings and developing data center connections.
- Cybernet Partnership: Joining forces with Cybernet, Pakistan’s leading fixed-line operator, ZOI has expanded its network footprint. This partnership leverages the strategic locations and network strengths of both Cybernet and ZOI, establishing a new point of interconnection at the state-of-the-art IP/MPLS and carrier Ethernet PoP in Equinix MC-1 data center in Oman. This collaboration not only enhances ZOI’s global backbone, it also provides rapid access to critical network infrastructure and global content, benefiting broadband, enterprise, and carrier customers with superior quality of experience.
- du Collaboration: ZOI and du aim to revolutionize roaming services across the Middle East. This strategic agreement enhances international roaming services across nine countries, delivering exceptional voice, messaging, and data roaming services powered by advanced 5G technology.
- Cable agreements: Entered strategic agreements on the AFRICA ONE cable, PEACE cable, and Blue Raman subsea cable as well as the construction of a 7,000 plus km fiber network across the region.
Elevating ZOI’s presence through strategic event sponsorships:
Participating and sponsoring in key industry events, boosting its brand visibility significantly, establishing its presence on the global stage, underscore ZOI’s commitment to engaging with industry peers, sharing insights, and exploring collaborative opportunities.
- Brand Launch at ITW 2023 in Maryland, USA: A landmark moment for ZOI was its official brand launch at the International Telecoms Week (ITW) 2023.
- Co-hosting GCCM 2023 in Muscat, Oman: Further solidifying its position as an industry leader, ZOI co-hosted the Global Carrier Community Meeting (GCCM) 2023 in Muscat. This event, a significant gathering for global telecom professionals, offered ZOI an unparalleled platform to showcase its capabilities, engage in meaningful discussions, and foster new relationships.
- Silver Sponsor of Capacity Europe in London, UK: Demonstrating its commitment to contributing to the growth and development of the carrier industry, ZOI participated as a Silver Sponsor at Capacity Europe in London.
Focusing on Sustainable Growth and Innovation
As ZOI looks to the future, its strategy is clear: To leverage the joint venture’s unique position and capabilities to become a frontrunner in the global wholesale market. This will be achieved through continuous investment in technology, sustainable practices, and strategic expansions. The foundation laid in 2023, marked by partnerships and innovative projects, is just the beginning of ZOI’s journey toward achieving excellence and setting new benchmarks in the wholesale carrier industry.
Diversity, Equity & Inclusion
Zain’s Diversity, Equity, and Inclusion (DEI) division, along with the relevant stakeholders, leverage Zain’s employees’ strengths and diversity in alignment with the corporate strategy, positioning Zain as a global force for positive change through its strategic programs: WE, gender diversity and inclusion; WE ABLE, disability inclusion; ZY, youth development; ZAINIAC, Zain’s internal innovation platform; BE WELL, wellness program; and REACH, mentoring initiative.
Zain also introduced the Zain Diversity, Equity & Inclusion University (DEIU) in collaboration with IE University in Spain. The partnership allowed 2,000 Zainers to enroll in an online Digital Transformation program, with the potential of earning a Master’s degree.
Following the certifications of multiple Zainers in a Train the Trainer certification on DEI, and working towards full organizational alignment, Zain aims to train 50% of the organization by 2025 on DEI.

WE
Partnering with human resources (HR), enhancements on the Group-wide family leave policy were implemented.
In 2022, Zain launched its WE SUCCEED program that brought high potential employees to the forefront of development on skills relating to leadership. The top 50% of participants were paired with senior sponsors to accelerate their careers in 2023 and beyond through scheduled meetings.
The introduction of the WE STEM team aims to add more women into technical fields. In 2023, the team successfully launched two data science competitions, addressing a telecom industry challenge, and developing in-house machinelearning solutions.

WE ABLE
In 2023, Zain participated in the 10th annual International Labor Organization conference, presenting the WE ABLE strategy. Key achievements in 2023 include the creation of Sign Language Databases for Kuwait, Iraq, Bahrain, and Jordan, all of which have been published on the Zain website. Additionally, inclusive hiring guides were launched, and dedicated sessions with each operation were conducted. Comprehensive training on digital accessibility and etiquette was provided to employees. Moreover, the GROW program was successfully launched in several operations, resulting in the hiring of five people with disabilities.
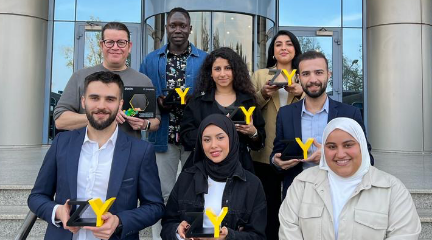
ZY
ZY is dedicated to empowering young employees with the knowledge and resources required to excel in the workplace. Zain Group introduced the Generation Z 2023 program, fostering an entrepreneurial mindset and enhancing skills relating to Zain’s strategy. Zain Bahrain initiated CODE 2030, a technology-focused employment program supporting and empowering Bahraini youth in the tech sector. Additionally, the launch of ZY Counsel, comprising eight talented Zainers nominated by their executive management teams, marks a transformative journey to address CEO challenges through innovative and strategic solutions.

ZAINIAC
In 2023, Zain reintroduced ZAINIAC, an online platform where employees can submit, collaborate, register, and engage in sprints and events. ZAINIAC offers clear evidence of Zain’s commitment to providing cuttingedge and innovative solutions. The ideas submitted undergo evaluation by the Vanguard, a committee of innovative Zainers from diverse backgrounds, who assess, mentor, and bring these ideas to life. A total of 629 ideas were submitted, accompanied by nine hosted events, resulting in seven successful implementations, leveraging three distinct creativity techniques.
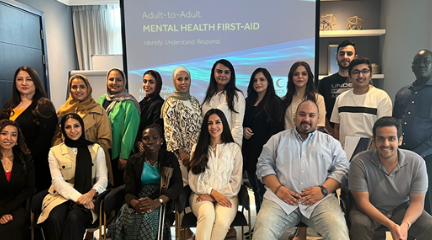
BE WELL
Zain introduced the new BE WELL strategy, emphasizing four pillars to promote wellness in the workplace and align with its objective of “Nurturing Belonging, Mindfully.” The pillars include Movement, focusing on activities to boost mood and reduce stress; Mindful, proactively promoting mindfulness and presentmoment awareness at work; Me, adopting an approach to recognize signs of distress in oneself and the team; and Mental Health, targeting stigma and providing mental health resources in a confidential manner. Zain continues to offer free counseling and therapy sessions through Kuwait Counseling Center for all employees, and a subscription to Tuhoon, an Arabic self-help organization providing tools and solutions to enhance mental health.
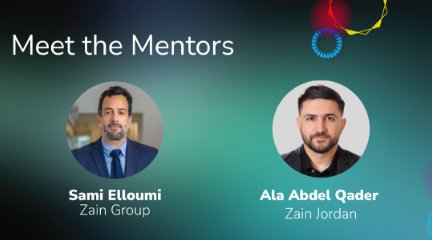
REACH
Under the mentoring initiative, Zain introduced the Express Mentor Route, a condensed experience of techrelated mentorships. Registration resulted in exclusive sessions with Zain’s top strategists and leaders, engaging with over 100 mentees.

DEI Awards
Zain was rewarded with the “Championship Award in Women Empowerment 2023” at the annual Global Good Governance Awards, held in Dubai and organized by Cambridge IFA, a UK-based think tank. Zain was also recognized with two prestigious awards at the SAMENA Council endorsed MEA Business Magazine Technology Achievement Awards 2023 for “Outstanding Sector Leadership and Growth” and for “Innovation, Collaboration, and Partnerships” for the DEIU Program.
Corporate Sustainability
Zain’s five-year Corporate Sustainability (CS) strategy incorporates the company’s operating context and focuses on establishing sustainable long-term value for its stakeholders. Over the course of the year, marking the fourth year since the implementation of the strategy, Zain conducted various activities to achieve the objectives set in its CS agenda.
Zain’s Mission
To provide Meaningful Connectivity leading to equitable systemic change and empower Zain’s communities
Zain’s Vision:


Safeguard the planet


Address societal challenges through the core business


Enable an inclusive digital society


Build the youth of the future
Strategic Pillars

Climate Change
Climate Change
Decarbonize our business & transition towards NetZero by 2050


Operating Responsibly
Operating Responsibly
Embed ESG across our value chain


Inclusion
Inclusion
Reduce the digital inequality gap


Generation Youth
Generation Youth
Build resilience across our communities by targeting 16 million children and youth


All topics and materials mentioned in this section can be found in greater detail in Zain’s 2023 Sustainability Report.

Link to report: https://zain.com/SR2023
Zain’s Sustainability Report is in alignment to the AA1000 Accountability Principles (AA1000AP) 2018; the Global Reporting Initiatives (GRI) standards; the Sustainability Accounting Standards Board (SASB) Standards, where it follows the Telecommunications Sustainability Accounting Standard Board (SASB); Task Force on Climate-Related Financial Disclosure (TCFD), United Nations Guiding Principles (UNGP) on Business and Human Rights Reporting Framework; ESG Reporting Guide published by Boursa Kuwait, GSMA ESG Metrics for Mobile; and the United Nations Global Compact (UNGC) principles.



Climate Change
Throughout the year, the company continued to achieve milestones and took strides to further its climate action agenda to transition to Net-Zero by 2050. Through its adaptation and mitigation plans, Zain can take the necessary steps to mitigate its climate change risks. The company also ensures it adheres to the unique challenges of each of its operating markets now and into the future. Some of the challenges include severe weather events such as flooding; infrastructure that is not equipped to address climate change; and the lack of a comprehensive regulatory environment.
Zain’s aim is to deploy energy efficient solutions in line with Science Based Targets initiative (SBTi) guidance set in each operation, and integrate mitigation and adaption plans through the following:
- Network and Energy Consumption Transition
- Strategic Approach & Communications
- Waste Management & Circular Economy
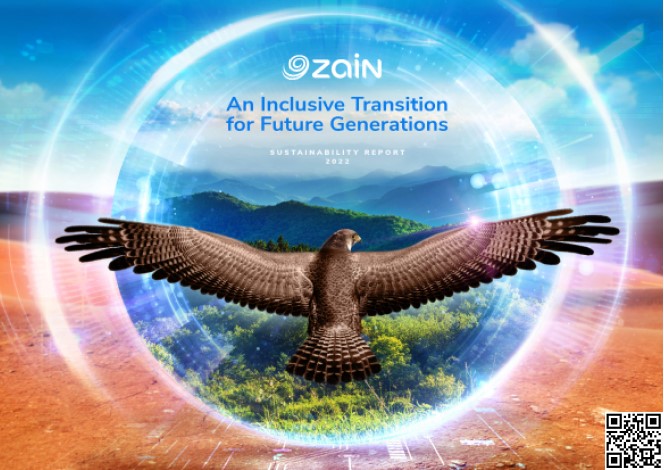
All topics and materials mentioned in this section can be found in greater detail in Zain’s 2022 Sustainability Report.
Link to report:
https://zain.com/SR2022
Zain’s Climate Action Journey Throughout the years:
The below are Zain’s Emission Reduction Performance and Targets for 2023, following the Greenhouse Gas (GHG) Protocol guidelines for the inventory of its emissions and emissions guidance based on SBTi recommendations:
Scope 1, 2 and 3 Emissions (including Sites, Data Centers and Head Quarter Buildings)
Note:
- For the conversion from liters of fuel to KWh, we considered that 1 L = 3KWh on the basis that 1 liter produces 10KWH with diesel generator efficiency of 30% as recommended by the GSMA
- DG-battery hybrid solutions usually lead to approximately 50% savings on fuel consumption
- Estimate of KWh for solar system is based on the data provided by Zain Jordan as per site monitoring and management solution. 750KWh is produced per site on average
- In Sudan, some of our base station sites were shut down due to the civil conflict, leading to a reduction in energy consumption across our network which resulted in lower emissions compared to the previous year.”
Scope 3 Emissions Breakdown
More initiatives on Climate Change Awareness, Waste Management and Circular Economy can be found on page 90 of Zain’s 2023 Sustainability Report.
*Sudan’s figure reflect the efforts pre-conflict (January 31 – April 14, 2023).
Year-on-Year Total Suppliers
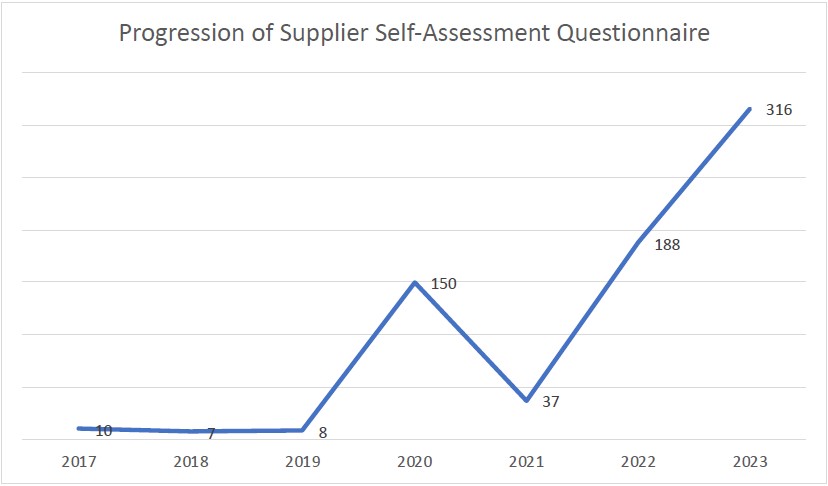
In 2023, Zain further developed its physical audit process by creating an additional level of verification by establishing an observation form. This form ensures Zain reports on risks identified as a result of physical audits.
*Sudan’s figure reflect the efforts pre-conflict (January 31 – April 14, 2023).
Generation Youth
Under the Generation Youth pillar the company set targets that are geared towards creating, building, and supporting ecosystems that foster the well-being of young people to ensure sustainable, inclusive growth and social cohesion in our region. Zain continued to focus on the following areas:
- Child Online Safety
- Digital Literacy
- Youth Unemployment

Child Online Safety:
Zain worked towards implementing its three-year MoU with Child Helpline International (CHI) to facilitate child helplines across its footprint. The partnership aims to mobilize, facilitate, and support child helplines in Zain’s markets of operation. Through the MoU, Zain can access new ways of developing engagements between child helplines and key child protection stakeholders, including government agencies and regulators, as well as ways to evolve child helpline platform software and technologies, and expand services to include instant messaging and social media channels. Through its first year, Zain and CHI successfully collaborated to enhance the effectiveness of helplines across Zain’s operational markets.
Digital Literacy
- ICT Lab (Zain Sudan)
Zain provided 60 computers to the computer laboratory at the University of Sudan. This initiative, tailored to benefit the Faculty of Computer and Information Technology, reflects Zain’s dedication to fostering digital literacy and academic upskilling within Sudan. The program was paused due to the conflict in the country, however Zain will continue to monitor the impacts of the war on infrastructure and devices donated to the lab. - Baims (Zain Kuwait)
Zain Kuwait partnered with the national e-learning platform Baims, to spearhead the digitalization of the education sector, tailored for high school and university students across five countries in MENA (Kuwait, Saudi Arabia, Bahrain, Jordan, and Turkey). Over the past year, the platform recorded 30 million views, and the outreach extends to over 150,000 active monthly users. - B-12 (Zain Jordan)
In collaboration with UNICEF and its B12 initiative, Zain Jordan continued to provide comprehensive online education to 20,000 students, ensuring a secure internet service for effective learning. This initiative also fostered collaborations with private schools and universities, extending educational outreach to an additional 3,000 students. - Girls for Tech (Zain Bahrain)
For the fourth consecutive year, Zain Bahrain partnered with the Supreme Council for Women to offer the Girls for Tech program, powered by Clever Play, an organization that embeds STEM learning in children’s education. The program provides girls aged 8-14 with skills in coding, website creation, and basic robotics.
Youth Unemployment
Evolve Program (Zain Saudi Arabia)
Continuing its success from last year, Zain Saudi Arabia continued its Evolve program, which targets fresh graduates to develop their skills to prepare them for the market’s demands. With a target of training 100 youth, Zain Saudi Arabia received 36,479 applicants where 154 people have been accepted and are part of the year-long on-the-job training program.
Ra’idat (Zain Iraq)
The Ra’idat Program, a local competition initiated by the French Embassy in Iraq and executed in collaboration with Zain Iraq and the Station, the first co-working space for entrepreneurs in Baghdad, aims to support and empower female Iraqis in their entrepreneurial pursuits. In 2023, the program achieved significant participation with over 150 females engaging in the competition.
Corporate Governance Report 2022
In an era defined by rapid technological advancements, shifting stakeholder expectations, and a heightened emphasis on sustainability, the realm of corporate governance has undergone transformative changes. The year 2023 marks a pivotal moment in the way organizations across the globe approach governance, with a renewed focus on accountability, transparency, and ethical practices. This Corporate Governance Report delves into the most important concepts shaping the contemporary business landscape, offering a closer look into how Zain is adapting to these challenges while striving for long-term value creation.
Zain Group has diligently established a robust corporate governance framework underpinned by proficient Board leadership. The organization remains steadfast in its pursuit of sustainable growth, thereby optimizing value for all stakeholders. Acknowledging the pivotal role of a corporate governance model in shaping decisions and fostering continuing value, the Board of Directors places significant importance on this facet. This commitment extends to investors, customers, shareholders, regulatory bodies, suppliers, and the communities in which we operate.
The Board looks to uphold the highest standards of corporate governance. This resolution is demonstrated through periodic analysis of regulatory developments and global benchmarks. Moreover, the Board systematically assesses the Company’s governance mechanisms and procedures to ensure their alignment with applicable laws, regulations, and international standards. The preservation of a supportive corporate culture and work environment forms a fundamental part of this endeavor.
We have continuously taken progressive strides in enhancing our governance framework. This has involved the introduction of policies capturing work ethics and governance principles, allowing heightened efficiency and ethical integrity to Zain Group’s undertakings.
This report provides a closer look at the eleven principles on which the governance laws in Kuwait are based, which include forming the Board; defining responsibilities and roles within the company; and evaluating and developing the Board’s performance. Furthermore, the document comprehensively includes details pertaining to both the Board and the executive team’s proficiencies. It expands on the remuneration of the Board and executive management, emphasizing transparency. Moreover, the report highlights the integrity of the financial statements, the robustness of risk systems, and the efficiency of internal controls.
The report’s scope covers a brief overview of the company’s rigorous endeavors towards integrated disclosure. This strategic pursuit is aimed at realizing transparency, averting potential conflicts of interest, and safeguarding the rights of shareholders and stakeholders.
The report also offers a segment on the company’s sustainability policy and the subsequent strategic initiatives, signifying the organization’s commitment to fostering long-term sustainability.
The traditional shareholder-centric approach to governance has evolved into one that prioritizes the interests of a broader range of stakeholders, including employees, customers, suppliers, communities, regulators, and the environment. Organizations are recognizing the connection between these stakeholders and their impact on sustainable business practices and overall success.
Environmental, social, and governance (ESG) factors have moved beyond being a mere checkbox and have become integral components of corporate strategy. The integration of ESG considerations into decisionmaking processes is now a fundamental aspect of demonstrating responsible and progressive governance.
Boards are increasingly expected to reflect the diversity of the communities and markets they serve. Diversity in terms of gender, ethnicity, age, and expertise not only enhances Board effectiveness but also contributes to a broader perspective on risk management and strategic planning.
As artificial intelligence (AI) and technology continue to drive innovation, companies are grappling with the ethical implications of their use. Establishing guidelines for the responsible development and deployment of AI, as well as ensuring data privacy and cybersecurity, has become a critical aspect of corporate governance.
Shareholders are leveraging their influence to hold companies accountable for their actions. Robust shareholder engagement, encompassing transparent communication and collaboration, is vital in maintaining a balanced and productive relationship between Boards and shareholders.
Our Board is redefining success beyond quarterly profits, focusing on long-term strategies that encompass financial performance, societal impact, and environmental sustainability. Zain received the formal approval of its commitment letter to the Science-Based Target Initiative (SBTi) to halve carbon emissions before 2030 and achieve Net-Zero carbon emissions by 2050. Zain also maintained its A- score in the ‘Carbon Disclosure Project (CDP) Score Report – Climate Change 2023’, a grade first achieved in 2021. In Saudi Arabia, the company launched the world’s first zero-carbon 5G network in the Red Sea powered by 100% renewable energy from over 760,000 solar panels covering 28,000km2. The company also conducted its first ever Responsible Supply Chain Management Forum, inviting representatives from its operations to ensure alignment embedding sustainability across its value chain process, with nearly 50 people in attendance. In addition, the company launched a training for its suppliers on human rights, ensuring that it embedded compliance mechanisms as well to verify supplier completion. For the first time, Zain submitted its communication of progress report under its membership with the United Nations Global Compact showcasing the company’s commitment to upholding human rights across its value chain.
With respect to children’s rights, Zain continued to progress its memorandum of understanding (MoU) with Child Helpline International by launching awareness campaigns in Jordan; engaging with the Ministry of Social Development in Bahrain to understand the current gaps in the helpline; and establishing a formal partnership with the National Family and Safety program targeting schools and rural communities in Saudi Arabia.
In an unpredictable world, effective risk management and resilience planning are vital. Zain aims to identify and address potential risks, from supply chain disruptions to geopolitical uncertainties, while maintaining the ability to adapt swiftly. Zain operates within a regulatory framework governed by a set of laws and regulations, meticulously designed to uphold the highest standards of governance and ethical conduct in its business operations. The Board assumes the pivotal responsibility of ensuring conformity to all pertinent laws and internationally recognized benchmarks. Concurrently, executive management plays a critical role in guaranteeing adherence to legal and regulatory mandates by effectively implementing policies and strategies.
The corporate environment at Zain thrives on the empowerment of decision-makers, through a commitment to diversity, inclusivity, integrity, and transparency. Central to this principle is the adherence to Zain’s code of conduct.
In accordance with the executive bylaw circulated by the Capital Markets Authority (CMA) in Kuwait, containing nineteen comprehensive modules, Zain is guided by an array of corporate governance regulations.
These regulatory measures, outlined by the CMA, serve as means for the progressive enhancement of entities. By establishing a cohesive governance framework, the CMA’s stipulations create a unified standard for companies operating under its remit.
Transparency remains a cornerstone of effective governance. Clear and comprehensive disclosure of relevant information, including ESG performance and risk exposure, builds trust with stakeholders and facilitates informed decision-making.
As we delve into this report, we uncover how Zain navigated these critical governance concepts in 2023. Zain has been incorporating ESG principles into its core strategies, and embracing a holistic approach to governance that not only enhances our competitive edge but also contributes to the greater societal good. This report offers insights into the strategies, challenges, and successes of Zain at the forefront of these governance shifts, shedding light on the path forward in this dynamic and ever-evolving corporate governance landscape.
In 2023, Zain was presented with the “Best Corporate Governance Award” in Kuwait for the third year in a row by World Finance, a print and online magazine providing comprehensive coverage and analysis of the financial industry, international business, and the global economy. The jury bestowed this award in recognition of the integrity and transparency of Zain’s practices. Zain has adopted a robust Investor Relations and Corporate Governance Framework that enhances the overall governance environment within the company in line with applicable laws, regulations, and leading practices. Wherever possible, Zain looks to exceed the requirements of corporate governance regulations.
The information contained in this report is based on the laws on corporate governance and their amendments issued by the CMA, the Ministry of Commerce and Industry, Boursa Kuwait and other relevant regulatory authorities in the State of Kuwait, and the laws and regulations of the jurisdictions in which the company operates. Zain decided to focus on efforts to promote innovation, open the way to face future challenges, and enhance competitiveness by implementing an innovative way of working within rapid transformations. Zain’s operations are based on principles according to the applicable laws.
The company executes its policies to protect the rights of stakeholders and to enhance the added value of all parties. This includes the economic, social, and developmental contribution through the activities of companies in the communities in which it operates. In addition, the Group pursues growth through innovative management, as it works to create new and unique value through partnerships and various projects. The company’s internal policies are also based on values, principles, and practices of global corporate governance.
The Board and executive management believe in building positive relationships among all stakeholders by strengthening corporate governance. One of the essential methods used by Zain in emphasizing the quality of reports in this regard is the auditing ESG reports by independent external auditors approved by the regulatory authorities. These reports and publications contain detailed information about ESG strategy, development, performance, and impact.
This corporate governance report has been prepared per the laws and regulations issued by the relevant governmental and regulatory agencies in Kuwait. A copy is also available on the company’s website, www.zain.com
The Board of Directors approved the Corporate Governance Report for the year 2023.
Construct a Balanced Board Composition
Establishing an appropriate framework for decision-making is among the pillars of sound corporate governance. It depends on assigning responsibility and providing transparent reports that ensure understanding and monitoring of the company’s development.
Below is an illustration of the company’s framework.
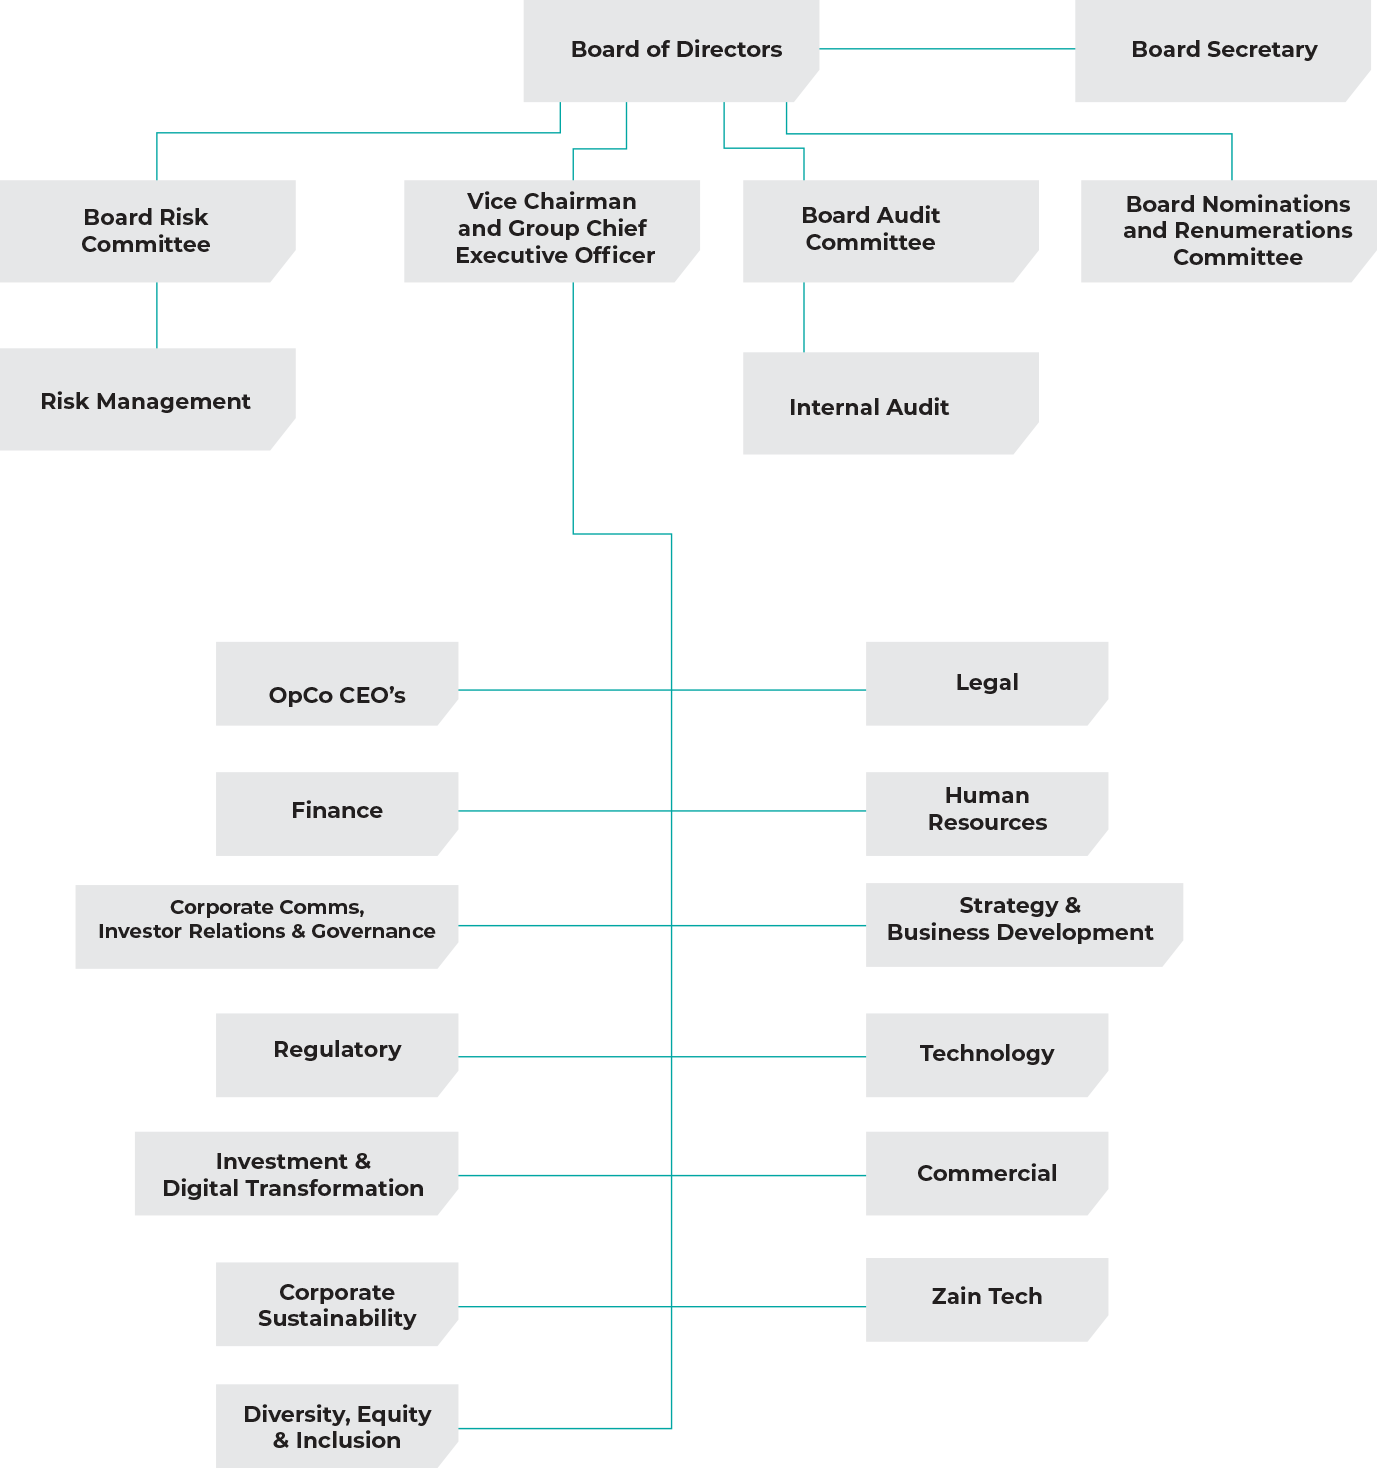
The Company’s Framework
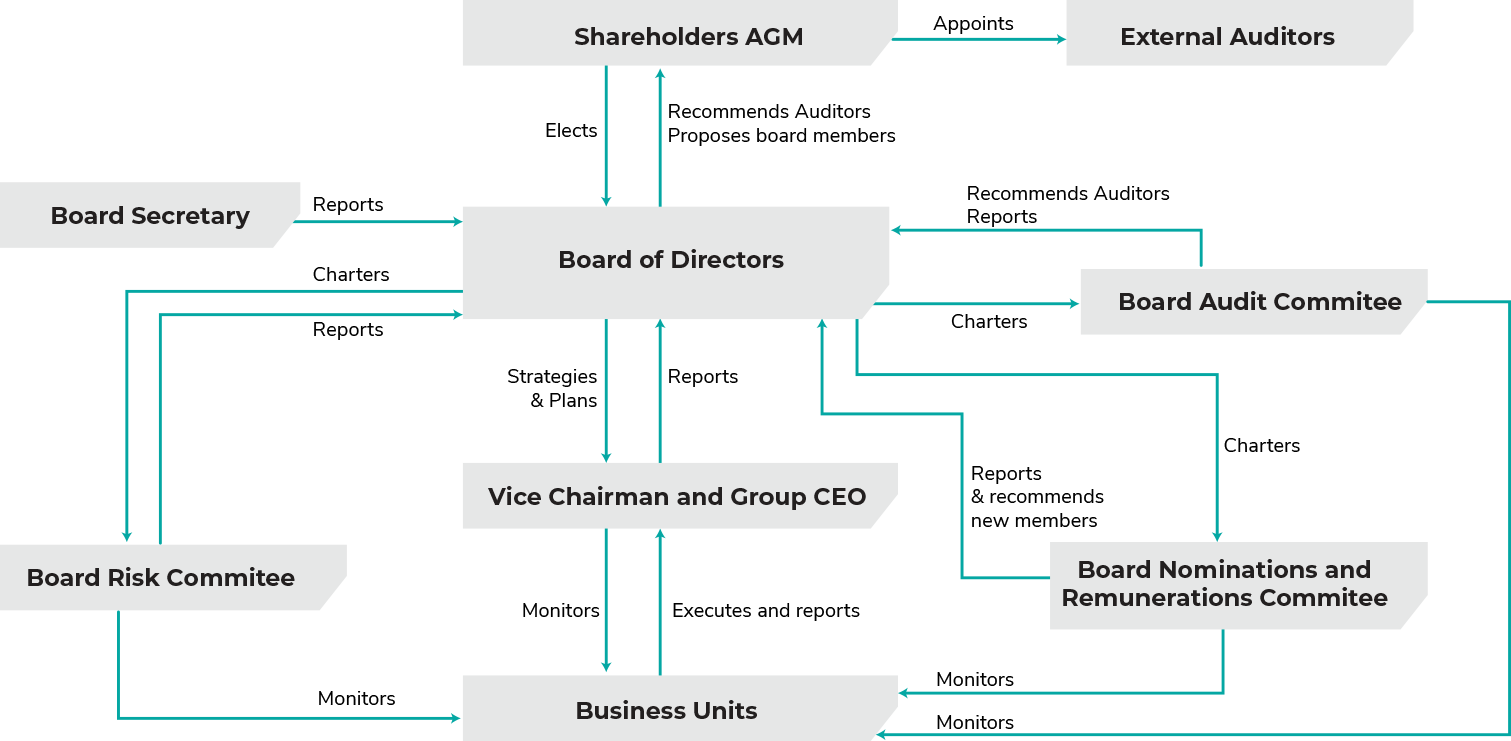
Applicable local laws and regulations
- Law no. 1/2016 [Companies Law]
- Capital Markets Authority: Law no. 7/2010
- Communications & Information Technology Regulatory Authority: Law no. 37/2014
- Boursa Kuwait – Rulebook
- Competition Protection Agency: Law no. 10/2007
- Kuwait Anti-Corruption Authority Law no. 2/2016
- Capital Markets Authority: Resolution no. 72/2015
About the Board of Directors
The following list includes a brief about the members of the Board, including information on the date of appointment, the educational and professional background of each member, in addition to the nature of the position.
Composition of the Board of Directors:
Board of Directors’ Meetings in 2023:
The Board meets at least six times during the year. The Chairman of the Board – or his Deputy in his absence – sends the invite for the meeting, through multiple communication means, including modern means of communication. The Chairman must call for an emergency meeting if a written request has been submitted to him from at least two members. The Board meeting shall not be valid unless attended by at least half of the members. The meeting may be held using the modern means of communication specified by the Board. Decisions may be taken by circulation, provided that this is done with the approval of all members of the Board. It is not permissible to attend Board meetings by proxy.
* The schedule includes all Board meetings held during 2023.
Meetings No. 2 No. 4, No 5 and No. 6 were conducted through modern means of communication.
Management of Board Meetings
The role of the Board Secretary includes guaranteeing that all members of the Board are equipped with the necessary tools to execute their responsibilities effectively. This includes the organization of Board and committee meetings and the thorough maintenance of minutes that accurately capture the diligent discharge of the Board’s duties. Furthermore, the Secretary assumes the role of a medium between the Board and the executive management, overseeing the timely provision of essential information to Board members. Additionally, the Secretary collaborates with Board members to facilitate meeting process, including the timely issuance of notices and prompt distribution of materials such as agendas and minutes.
The Secretary provides assistance to the Board Chairman in creating meeting agendas, submitting necessary documentation, overseeing and tracking meeting outcomes, and aligning with the approved operational schedules.
Upon the Board’s validation of meeting minutes, they attain official status as a corporate record, serving as documented evidence of the Board members’ accomplishments and any challenges encountered. Within these sessions, the Board endorses key policies and establishes a timeline for objectives and business strategies.
The Board Secretary documents the minutes of every meeting, upholds records of committee sessions, supervises processes associated with Board membership, organizes official archives and Board-related documents, and disseminates notifications for planned meetings as stipulated in the company’s policies. The role of the Board Secretary is essential in accommodating the Board’s expanding duties. It involves duties such as overseeing compliance-related activities, administering Board operations, circulating materials for deliberation and proposals presented to the Board and its committees by management (no less than three days prior to meetings), and guaranteeing that interactions between the Board and executive management adhere to legal, regulatory, and internal policy requisites.
The Board Secretary sends invitations to relevant stakeholders for attendance at Board meetings and its committees. Additionally, the Secretary undertakes the responsibility of generating, accurately maintaining, and regularly updating essential records. These reports are accurately prepared to align with legal mandates and obligations as set by relevant regulatory bodies. In this capacity, the Board Secretary also offers guidance on the duties and obligations of the Board, per the applicable laws, regulations, company policies, and charters, which include the code of ethical conduct.
The scope of the Secretary’s duties incorporates documenting both the discussions and decisions made by Board members, along with recording the outcomes of voting procedures conducted during these meetings. Operating under the oversight of the Chairman, the Secretary assures the execution of Board-approved decisions in alignment with the company’s policies. Accessibility to these documents and records is extended to every Board member.
The Secretary remains aware of the external landscape, ensuring a thorough understanding of prevailing corporate governance trends, emerging concerns, and industry-leading practices, with a particular focus on the telecommunications sector, as guided by the Chief Communications Officer. Moreover, the Secretary informs the Board of developments relating to corporate sustainability, as directed by the Chief Sustainability Officer. This engagement contributes to effectively accent the company’s strategic sustainability objectives.
Furthermore, the Board Secretary actively assists newly appointed Board members by extending support through an induction program. This program contains comprehensive information about the company, its operations, and activities. It also provides insights into the roles of the Board, its committees, and the executive management, detailing the responsibilities associated with these positions. The program further includes an overview of the Group’s operations, performance results, interactions with the executive management team, and the budgetary planning for the entire year.
The independent member acknowledges that the independence controls are met, and a copy of the declaration is included to the report in Arabic.
Establish Appropriate Roles and Responsibilities
The roles and responsibilities of the Board of Directors and executive management
The Board of Directors consists of nine members, including one independent member and one executive member. The Board of Directors serves as a crucial oversight body, responsible for ensuring the company’s long-term sustainability, ethical behavior, and effective decision-making. The Board is responsible for overseeing the management of the company and ensuring that the company operates in the best interests of its shareholders, stakeholders, and in compliance with relevant laws and regulations. This means making decisions that benefit the company as a whole and protecting shareholders’ investments. The Board ensures that the company complies with applicable laws, regulations, and industry standards. It establishes compliance policies and monitors the company’s adherence to them.
The Board plays a key role in setting the company’s strategic direction. It approves the company’s mission, vision, and long-term goals. It also reviews and approves major strategic initiatives and business plans. The Board is responsible for identifying, assessing, and managing risks that could impact the company’s financial performance or reputation. This involves reviewing risk management policies and procedures and ensuring that appropriate risk mitigation strategies are in place. It oversees the company’s executive management team and evaluates the performance of executives, appoints, and dismisses top management, and approves executive compensation plans.
The Board reviews and approves the company’s financial statements, ensuring their accuracy and compliance with accounting standards. It also monitors the company’s financial performance, and liquidity.
The Board established the code of conduct and ethics for the company and its employees. It ensures that the company operates ethically and maintains its reputation in the marketplace. The Board exercises diligent oversight on ethical issues safeguarding a culture of integrity. The Board of Directors has a functional role in overseeing business ethics and compliance, ensuring that emerging issues are promptly addressed and resolved.
The Board is responsible for its own composition and effectiveness. It identifies and recruits qualified directors, plans for director succession, and promotes diversity and inclusion on the Board. The Board members have diverse expertise and skills across various industries. They create strategies and goals that maximize both short-term and long-term value for the company.
The Board maintains open communication of the company’s plans, ensuring that investors understand long-term prospects and forthcoming possibilities, all while recognizing and addressing existing and potential risks.
Zain’s Articles of Association (AOA) determine the requirements and the basis on which the members of the Board are elected. The General Assembly elects Board members by secret ballot. The membership term of Board members is three years, subject to renewal, provided the independent members make up 20% or more of the Board’s composition. The AOA include more details, such as the conditions for the independence of members and the loss of membership, the Board’s responsibilities, additional requirements for the selection of the Chairman, and instructions regarding Board meetings and attendance. All items in the AOA are based on relevant laws, regulations and guidelines, and the document is available on Zain’s official website.
The Board elects a Chairman and a Vice-Chairman by secret ballot, and also appoints the CEO from among the members of the Board or others.
The Chairman of the Board represents the company in its relations with third-parties and before the judiciary, in addition to other terms of reference indicated in the AOA and Board meeting minutes. The Vice-Chairman shall take the Chairman’s place in his absence, or if he is prevented from exercising his powers, or whenever necessary.
The Board may distribute the work among its members according to the nature of the company’s business. The Board may also delegate one of its members, a committee from among its members, or a third-party to carry out a specific job or more, or supervise one aspect of the company’s operations, or exercise some of the powers or competencies entrusted to the Board.
This authority is not restricted except by what is stipulated in the law, the AOA, or the resolutions of the General Assembly. The Board is dedicated to fulfilling its responsibilities in alignment with approved internal policies. These policies encompass various aspects of Board operations, including meeting protocols, roles, and obligations, all in accordance with applicable laws and regulations. Moreover, the Board supervises the main capital expenditures of the company and develops a corporate governance framework, code of conduct, and policies related to ESG affairs. The Board creates a system to monitor the performance of each Board member and the performance of its committees and executive management according to key performance indicators, including ESG criteria.
Every year the Board prepares an annual report to be read by the Chairman at the Annual General Assembly. The Corporate Governance report includes details about the procedures and measures undertaken by the company to complete the corporate governance requirements and the extent of compliance and determines the powers delegated to executive management.
Moreover, to enhance efficiency, effectiveness, transparency, and accountability, the Board sets the company’s values and standards, ensuring that they align with its strategic objectives and corporate culture. It also ensures that the company’s obligations are understood by its shareholders and other stakeholders, including employees, suppliers, customers, law authorities, and the environment in which the company operates. The Board is also concerned with evaluating the appropriateness of the internal control and audit systems.
The Board ensures that executive management has adequate risk management systems and procedures, and implements sufficient and effective internal controls.
The Board continuously reviews the implementation of good corporate governance. The company has established a governance structure that enables the Board to focus on key areas of responsibility that affect the long-term success of the business. This structure involves forming three board committees: the Audit Committee, the Risk Committee, and the Nominations and Remunerations Committee. These committees are formed according to the laws.
The Board supervises compliance with the laws, company objectives, AOA, and decisions of the General Assembly while adhering to the principles of governance, best practices, and work ethics. This includes allocating sufficient time to adopt the company’s vision, mission, directions, and strategies. In addition, Board members attend meetings and review and approve the main strategies and policies, as well as the company’s financial objectives and operational plans.
As the Board plays a supervisory role, the responsibility for implementing the approved strategy rests with the CEO and executive management, leading to delegating the required work to the right employees within the company. Board members develop a clear strategy and business model and work closely with executive management within a set timeframe to drive continuous business growth in a changing world. This is pivotal to the company’s success.
The control environment is the set of standards, processes, and structures that provide the basis for implementing internal control across the company. The role of the Board of Directors is considered crucial in ensuring the establishment of a control environment to guarantee the effectiveness of the anti-corruption policy. The antimoney laundering policy at Zain guarantees the creation of a proper framework under the relevant laws and regulations to combat corruption. The Board is also responsible for supervising a system that effectively supports the anti-corruption policy and oversees the executive management to safeguard the implementation of the policy. In addition, the board ensures raising employee awareness within the corporate culture, emphasizing this policy’s importance.
The Board’s responsibilities include handling and resolving potential conflicts of interest and transactions involving related parties. It achieves this by carefully evaluating such transactions to guarantee optimal advantages for both shareholders and stakeholders. Furthermore, the Board establishes effective lines of communication with shareholders and supervises the accurate, consistent, transparent, and credible disclosure of material information, maintaining the highest standards of disclosure quality.
Both the Board and executive management acknowledge their obligation to society and the environment, highlighting the significance of sustainability. Accordingly, they emphasize enhancing the well-being of individuals within the communities where the company conducts its operations.
Board Achievements in 2023
- Approving a new dividend distribution policy of 35 fils per share as a minimum for a period of three years starting from the distributions of the year 2023.
- Reviewing and approving a set of policies during the year 2023, aiming to include strong regulatory oversight frameworks in line with applicable laws and regulations and to implement best practices and international standards.
- Launching the “WE ALIGN” program, which establishes a new phase of mutual cooperation between Zain and Omantel, to achieve goals that serve the strategic visions of the next phase.
- Launching Zain-Omantel International Company (ZOI), expected to revolutionize wholesale business operations in the telecommunications sector.
- Zain Saudi Arabia completed a sale and leaseback deal for 8,069 towers for SAR 3.03 billion (USD 807 million) to an association led by the Public Investment Fund of the Kingdom.
- Signing a specific term agreement (15 years) for the sale and leaseback of Zain Iraq’s tower infrastructure with TASC Tower company for USD 180 million.
- Finalizing agreements with Ooredoo Group and TASC Towers to establish the largest tower company in the Middle East and North Africa region, owned by cash and share stakes among the three parties. The expanded tower company will comprise approximately 30,000 communication towers, with a current estimated project value of around USD 2.2 billion.
- ZainTech acquired Adfolks, a company specialized in cloud services and digital infrastructure project development.
- ZainTech signed an agreement to acquire Computer Technical Services (STS), a leading company in providing digital transformation solutions and IT services in the Middle East and North Africa markets.
- The financial technology arms of the group (Tamam and Zain Cash) grew beyond expectations during this period.
- Brand Finance classified Zain as the strongest brand in Kuwait with a rating of AA++, and in the latest ranking by the global rating agency, the brand value of Zain on the Brand Finance index increased by 14% to reach USD 2.7 billion.
Board Committees
The Board has effectively allocated specific responsibilities to its committees, aiming to enhance efficiency and optimize the time of its members. These committees are tasked with providing recommendations to the Board, which retains overall accountability for decision-making.
The utilization of committees enables members to develop a deeper understanding of the company, encouraging active engagement and leveraging their expertise to emphasize the Board’s commitment to addressing diverse concerns. Board committees offer several benefits, primarily by fostering a decentralized approach that encourages specialized knowledge. This structure proves particularly valuable in fulfilling the Board’s oversight obligations, as certain matters necessitate specialized insights. Thus, it reorganizes the distribution of tasks among members, bolstering stakeholders’ confidence in the Board’s ability to diligently execute its supervisory role. Furthermore, this approach contributes to maintaining the Board’s independence from executive management. As Board committees have allocated time to delve into specific tasks, the Board places significant reliance on their execution of duties, emphasizing accuracy and timeliness in fulfilling their obligations. In instances where the Board seeks comprehensive insights, committees are expected to provide information, to contribute to the resolution of particular matters.
Committee decisions are then presented to the Board for approval, alongside the action plans for their implementation. Furthermore, the committees play a vital role in overseeing the execution of these decisions by the respective departments.
Within Zain’s governance framework, three distinctive committees have been established: the Risk Committee, the Audit Committee, and the Nominations and Remunerations Committee. The following sections provide a comprehensive overview of these committees, highlighting their roles, accomplishments, and contributions.
Board Risk Committee (BRC)
Formed: 12 May, 2015
Term: The membership period is the same as the term of the Board of Directors and not more than three years, renewable.
Responsibilities:
The purpose of the Risk Committee (BRC) is to assist the Board with fulfilling its responsibilities related to identifying, assessing, and mitigating risks. These risks include operational risks, strategic risks, and external environment risks. Therefore, the committee is generally responsible for reviewing, monitoring, and approving the risk policies, frameworks, processes, and practices associated with the company. The BRC is also responsible for reviewing and approving risk disclosure data in public documents and oversees business ethics and compliance issues. In addition, it must ensure that the company takes appropriate measures to achieve a balance between risk and return in both ongoing and new businesses. The BRC assesses significant risk exposures and evaluates management actions to mitigate the exposures on time, including one-off actions by the company and continuing activities such as business continuity planning and disaster recovery planning. The BRC’s responsibilities include coordinating with the audit committee as needed. The BRC submits regular reports to the Board.
The BRC reviews and reassesses the adequacy of internal procedures in this regard within the scope of its responsibility and recommends any proposed changes to the Board for approval. The BRC has access to any internal information necessary to perform its role. The BRC ensures that executive management’s risk management policies and procedures align with the company’s strategy and risk appetite. It also promotes a company-wide culture that supports appropriate awareness of risks, behaviors and provisions related to risks and ensures that problems are addressed on time. The BRC’s supervisory functional role includes evaluating executive management’s performance.
Achievements of BRC in 2023
- Reviewed and discussed the risk management quarterly report for the Group and its subsidiaries and defined a work methodology to ensure the reduction of the impact of risks. The committee also reviewed the management activities every quarter.
- Assessed all kinds of risks in subsidiaries and worked to reduce their impacts.
- Monitored cybersecurity protection procedures and the extent of progress and development in protection systems to ensure mitigating the risk of attacks and to ensure maximum levels of protection.
- Reviewed related party transactions, discussed their impact and made recommendations to the Board
- Opened and sponsored the annual risk conference to discuss aspects of cooperation between subsidiaries.
- Reviewed the Privacy and Data Security Policy, addressing all concerns and issues related to privacy and data security brought forth by the Risk department.
Committee Members:
Zaki Hilal Saud Al Busaidi (Committee Chairman)
Bader Nasser Al-Kharafi
Talal Said Al Mamari
Yousef Khaled Al-Abdulrazzaq
Atif Said Rashid Al Siyabi
Number of committee meetings in 2023: 4
Board Audit Committee (BAC)
Formed: 9 June 2011
Term: The membership period is the same as the term of the Board of Directors and not more than three years, renewable.
Responsibilities: The Board Audit Committee (BAC) is responsible for assisting the Board in performing its duties concerning
- Overseeing the quality and integrity of accounting practices, auditing, internal control, risk management framework, financial reporting, and the overall corporate governance framework.
- Evaluate the performance and qualifications of the licensed independent auditor (the external auditor).
- The firm’s relationship with external auditors.
- The overall performance of the company’s internal audit unit.
- In addition to complying with applicable laws and regulations.
The Board of Directors is responsible for the company’s risk management, internal control, and corporate governance. The BAC’s role includes focusing on the various aspects of preparing financial reports, managing business operations and financial risks, overseeing compliance with applicable legal, ethical, and regulatory requirements, and overseeing the performance of the internal audit department and the independent external auditors.
Achievements of BAC during 2023
- Monitored the work of the internal audit department for the year 2023.
- Reviewed and discussed the internal audit report on a quarterly basis for the group and its subsidiaries and followed up on closing the observations.
- Approved the internal audit plan and strategy for the years 2023 and 2024.
- Reviewed and audited Zain Group’s consolidated financial statements on a quarterly basis, discussed them with executive management and provided recommendations to the Board.
- Met with the external auditor every quarter to review and discuss the external auditor’s report on the financial and operating performance of the Group.
- Evaluated the performance of executive management in closing observations with high and annual risks, linking.
- Monitored the cases and correspondences the company received from authorities and government bodies.
- Recommended the appointment or reappointment of the external auditor and submitting it to the Board and during the Annual General Meeting.
- Recommended the appointment of the new Chief of Internal Audit in accordance to applicable instructions and regulations.
- Reviewed and approved the three-year internal audit plan that covers all operations and approved policies.
Committee Members:
Nasser bin Suleiman Al-Harthy (Committee Chairman)
Aladdin Baitfadhil
Abdulrahman Mohammad Ibrahim Al Asfour (independent)
Yousef Khaled Al-Abdulrazzaq
Number of committee meetings in 2023: 6
Board Nominations and Remunerations Committee
Formed: 12 May 2015
Term: The membership period is the same as the term of the Board of Directors and not more than three years, renewable.
Responsibilities: The Nomination and Remuneration Committee (BNRC) assists the Board in fulfilling its oversight responsibilities of the effectiveness, integrity, and compliance with the company’s remuneration and nomination policies and procedures. The BNRC must ensure that the remuneration policy is consistent with the company’s strategic objectives and should also review and approve the selection criteria and appointment procedures for a member of the Board of Directors and senior management and ensure that the overall nomination policy and approach is consistent with the strategic objectives. This committee is responsible for nominating and re-nominating members of the Board and Executive Management. It also conducts an annual review of the required skills and competencies in the Board and Executive Management, considering the company’s approved strategic objectives and corporate governance rules issued by the CMA. In coordination with the Executive Management, the BNRC shall prepare the succession plan for the Executive Management, including emergency cases or unexpected vacancies, to ensure the sustainability of the company’s business. The BNRC maintains a training system to develop the skills of employees and evaluates the performance of management and facilitates the evaluation of the Board. The BNRC plays a vital role in the remuneration of the Board and Executive Management, following applicable regulations.
Achievements of BNRC during 2023
- Approved the mechanism for calculating and distributing annual remuneration for management.
- Determined the remuneration of the members of the Board of Directors and submitted it to the Board for approval.
- Discussed and approved evaluation mechanism of the Board, which agreed on conducting self-evaluation.
- Approved a number of training programs for Board members
- Reviewed and approved the company’s organizational structure and succession plan policy
- Identified replacements for each of the senior management positions in the company, in accordance to the succession policy
- Recommended the acceptance of the nomination of the Chief Internal Auditor in accordance with the instructions and regulations.
Committee Members:
Atif Said Rashid Al Siyabi (Committee Chairman)
Osamah Othman Al Furaih
Bader Nasser Al-Kharafi
Talal Said Al Mamari
Abdulrahman Mohammad Ibrahim Al Asfour (Independent)
Number of committee meetings in 2023: 2
CORPORATE GOVERNANCE FRAMEWORK
Board of Directors
The Board of Directors defines the objectives and strategy which aim to protect the company by providing effective governance measures and guidelines. This includes setting limits and processes, and approving internal policies and procedures for the executive management and employees in general, which leads to safe operation, protecting the rights of all stakeholders, providing stability and sustainability, and ensuring the long-term success.
Risk Committee
The committee aims to encourage the effective oversight of the board over material transactions within the company. This committee is responsible for managing corporate risks, which include but are not limited to strategic risks, market risks, compliance and operational risks.
Nominations and Remunerations Committee
This committee is responsible for recommending the appointment of members of the Board and the Executive Management, facilitating the annual evaluation of the Board’s performance, and supervising the training and development process of the Board and the Executive Management. It evaluates the compensation of the Board and the executive management relative to the company’s long-term goals.
The Audit Committee
This committee is responsible for assisting the Board of Directors in its responsibilities relating to the oversight of the quality and integrity of the accounting and auditing processes, internal controls, risk management framework and financial reporting practices of the company, as well as the company’s relationship with the external auditors.
Chief Executive Officer
Executive Management
Managing the company’s business operations by supervising daily activities, implementing the company’s strategic plans, policies and internal charters, and ensuring their efficiency and effectiveness
Risk Management Department
Managing risks efficiently to integrate any new business undertaken by the company. this department is independent and reports to the BRC. It is allocated sufficient administrative resources to identify, assess and handle risks appropriately
Governance and Compliance Department
Monitor the implementation of the defined governance framework to ensure the quality of the application and ensure compliance with applicable laws and regulations; review and evaluate the governance framework to confirm full compliance with the laws and regulations.
Internal Audit Department
Independence of this department is guaranteed through reporting to BAC. It has access to sufficient resources. The committee provides the Board and the executive management with an objective and comprehensive view of the business.
Relationship between the Board of Directors and the Executive Management
The establishment of a prosperous connection between the Board and executive management stands as a cornerstone with respect to sound governance and organizational proficiency. At Zain, a balanced union takes place between the Board and executive management, allowing the efficient exchange of information. This connection facilitates competent decision-making, supported by constructive discussions, and a commitment to the company’s strategy.
The strength of the connection between the Board and executive management hinges on a foundation of shared understanding, encompassing key elements such as the company’s mission, vision, strategic framework, team capabilities, implementation plans, and performance goals. Yet, the essential foundation of this partnership becomes evident through an understanding that defines the boundaries of their specific roles, responsibilities, and limited areas of authority. This understanding, in turn, fosters an atmosphere where each stakeholder is inclined to deeply respect the significance of the other party’s obligations, contributions, and expectations.
The Board shapes the company’s trajectory by establishing corporate objectives and strategic direction. Furthermore, the Board safeguards the organization by establishing parameters and protocols for both the executive management and the broader workforce. This ensures secure operations and sustainable accomplishments, with these limits being embodied in internal policies and procedures.
The company’s governance framework establishes policies and procedures that underpin the Board’s relationship with executive management, defining their respective roles and expectations. It’s crucial to implement these principles in the corporate culture and the interaction between the two parties.
The Board empowers company operations by aiding executive management and resource development. Executive management oversees policy execution and goal achievement according to the approved strategy. The Board authorizes and sets limits for executive management’s work. Operational plans stem from the Board’s strategic guidance, enabling goal achievement and integrity maintenance. Executive management’s role is crucial in tandem with the Board for accomplishing the company’s mission.
The Board oversees executive management by monitoring performance, ensuring accountability, investigating issues, offering direction, and sharing expertise. Board members depend on timely, comprehensive information from executive management to fulfill their responsibilities effectively.
Similarly, executive management anticipates the Board’s trust in executing the endorsed strategy and attaining outcomes. The Board establishes transparent performance goals and authority boundaries to facilitate seamless performance.
An aspect of the Board’s role is selecting skilled executive management. The Board designates the CEO to communicate this vision to the management team. The executive management, including the CEO, views the Board as a resource to enhance company performance, while the Board recognizes the benefits of collaborating with a capable executive team.
The Board assesses the CEO and executive management alongside the CEO and BNRC. Thus, the CEO comprehends senior management’s performance criteria from the Board’s directives. This evaluation focuses on ongoing enhancement, providing clear Board expectations. Zain’s corporate culture hinges on candid, direct communication, fostering trust and aligning Board and executive management for shareholder objectives. Executive management executes strategy decisions within Board guidelines to ensure goal and policy alignment.
Recruit Highly Qualified Candidates for the Members of a Board of Directors and the Executive Management
About the Board of Directors
Board Nominations and Remuneration Committee (BNRC)
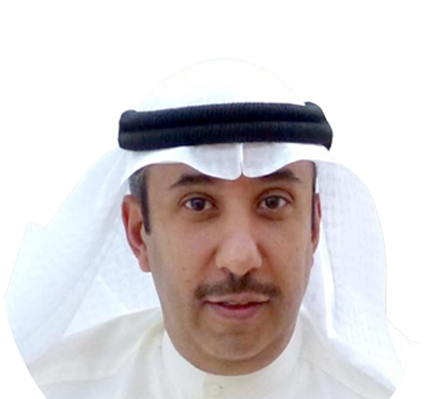
Osamah Othman Al Furaih
CHAIRMAN OF THE BOARD OF DIRECTORS
- A representative of Kuwait Investment Authority
- Member of the Board of Directors since 2023
- Chairman of the Board of Directors since 2023
Date of birth: 1973
Education: Bachelor’s degree in Business Administration from Tennessee State University
Work Experience
Other Memberships
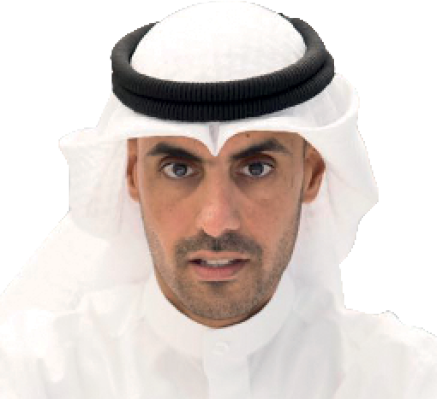
Bader Nasser Al-Kharaf
VICE CHAIRMAN AND GROUP CEO
- Member of the Board of Directors since 2011
- Vice Chairman of the Board of Directors since 2014
- Group CEO since 2017
Date of birth: 1977
Education: Master of Business Administration degree from London Business School, and Bachelor’s degree in Mechanical Engineering from Kuwait University, and currently pursuing a PhD at IE Business School in Spain.
Work Experience
Other Memberships
Talal bin Said Al-Mamar
MEMBER OF THE BOARD OF DIRECTORS
- Member of the Board of Directors since 2017
Date of birth: 1972
Education: Bachelor’s degree in Business Administration from Duquesne University, Pittsburgh – Pennsylvania, as well as Senior Executive Program from London Business School, UK
Work Experience
Other Memberships
Abdul Rahman Mohammed Ibrahim Al-Asfour
INDEPENDENT BOARD MEMBER
- Member of the Board of Directors since 2018
Date of birth: 1981
Education: Bachelor’s degree in Business Administration with a major in Accounting from Kuwait University
Work Experience
Other Memberships

Yousef Khaled Al-Abdulrazzaq
MEMBER OF THE BOARD OF DIRECTORS
- A representative of the Kuwait Investment Authority
- Member of the Board of Directors since 2018
Date of birth: 1983
Education: Bachelor’s degree in Business Administration, majoring in Finance, from Kuwait University
Work Experience
Other Memberships
Zaki bin Hilal bin Saud Al Busaidi
MEMBER OF THE BOARD OF DIRECTORS
- Member of the Board of Directors since 2020
Date of birth: 1973
Education: Master’s degree in public administration from the University of Exeter, United Kingdom, and Bachelor’s degree in public administration from Yarmouk University in Jordan
Work Experience
Other Memberships

Atef bin Said bin Rashid Al-Siyabi
MEMBER OF THE BOARD OF DIRECTORS
- Member of the Board since 2020
Date of birth: 1980
Education: Bachelor of Engineering in Computer Hardware and Network Technology from Coventry University, a Master of Business Administration from Franklin University, Certificate in Professional Leadership Development from HEC Paris.
Work Experience
Other Memberships
Aladdin Fadelbeit
MEMBER OF THE BOARD OF DIRECTORS
- Member of the Board since 2020
Date of birth: 1978
Education: Bachelor’s degree in electrical and electronic engineering from Sultan Qaboos University, He holds two certificates in Disruptive Strategies and Leading with Finance from Harvard University.
Work Experience
Other Memberships
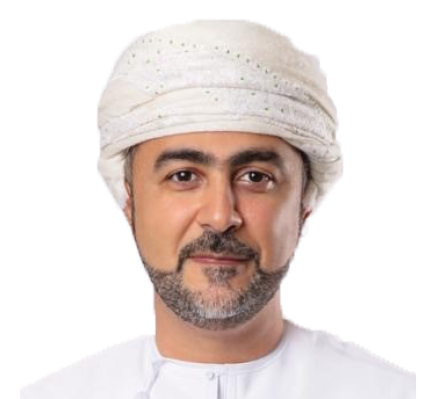
Nasser bin Suleiman MEMBER OF THE BOARD OF DIRECTORS Al-Harthi
MEMBER OF THE BOARD OF DIRECTORS
- Member of the Board since 2020
Date of birth: 1975
Education: Master of Business Administration from Victoria University in Australia, Bachelor of Finance from the United Arab Emirates University, National Leadership and Competitiveness Program (NLCP) from Oxford University.
Work Experience
Other Memberships
About the Executive Management at Zain Group
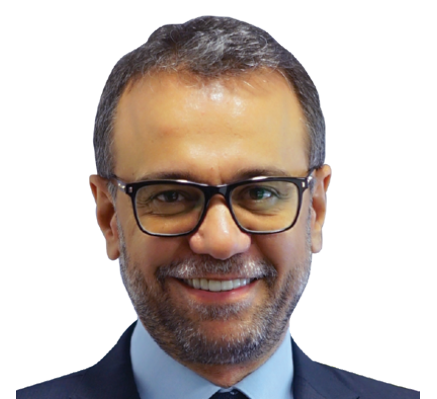
Ossama Matta
CHIEF FINANCIAL OFFICER
Appointment Date: 2010
Education: Master’s degree in Business Administration from the American University of Beirut and CPA certificate
Work Experience

Nawaf Algharabally
CHIEF TECHNOLOGY OFFICER
Appointment Date: 2020
Education: Master’s degree in Business Administration from London Business School
Work Experience

Nawal Bourisli
CHIEF PURPOSE AND HUMAN RESOURCES OFFICER
Appointment Date: 2018
Education: Completed a leadership development program at Harvard Business School.
Work Experience
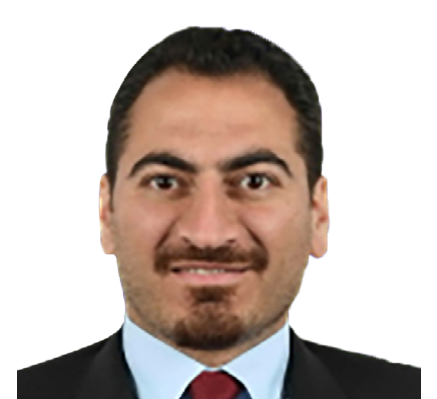
Malek Hammoud
CHIEF INVESTMENTS AND DIGITAL TRANSFORMATION OFFICER
Appointment Date: 2017
Education: Bachelor’s degree in Electrical Engineering from the American University of Beirut, MBA from the London School of Business, and a Chartered Financial Analyst (CFA).
Work Experience
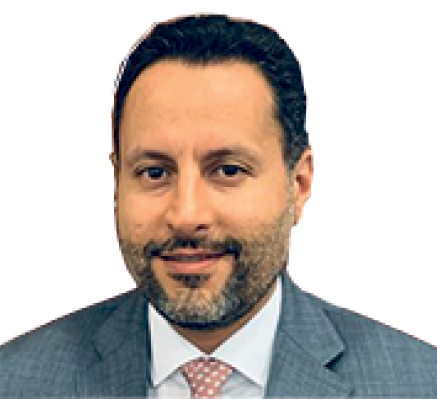
Kamil Hilali
CHIEF STRATEGY OFFICER
Appointment Date: 2018
Education: MSc. in Industrial Engineering from ENIM (Morocco), Master of Business Administration from Suffolk University (MA, USA), and Master of Finance from London Business School (UK) and professional Venture Capital training from Stamford University (CA, USA).
Work Experience
Mohammad Abdal
CHIEF COMMUNICATIONS OFFICER
Appointment Date: 2015
Education: Bachelor of Science in Business Administration with a double major in Finance and Information Management Systems from Portland State University, USA
Work Experience
Jennifer Suleiman
CHIEF SUSTAINABILITY OFFICER
Appointment Date: 2018
Education: Degree in Art History and Archeology from Washington University, Missouri, USA
Work Experience

Dr. Andrew Arowojolu
CHIEF REGULATORY OFFICER
Appointment Date: 2016
Education: Ph.D. in mobile wireless communication, Master’s in Microelectronics and Communication from the University of Liverpool, Bachelor’s in Electrical and Electronic Engineering from the University of Lagos, LLM (Master of Law) degree in Technology Media and Telecommunications Law (Distinction) from the Queen Mary University of London Center for Commercial Law Studies.
Work Experience
Firas Oggar
HEAD OF LEGAL
Appointment Date: 2017
Education: Master’s degree from the University of Paris in International Business Law
Work Experience
Abdul Ghaffar Setareh
CHIEF RISK OFFICER
Appointment Date: 2016
Education: Telecommunications Engineering degree from Rabat, Morocco
Work Experience

Maryam Saif
CHIEF DIVERSITY, EQUITY AND
INCLUSION OFFICER
Appointment Date: 2017
Education: Master’s degree in Organizational Behavior and Bachelor of Science in Computer Programming from London Met University, Strategy Execution from Said Business School, University of Oxford.
Work Experience
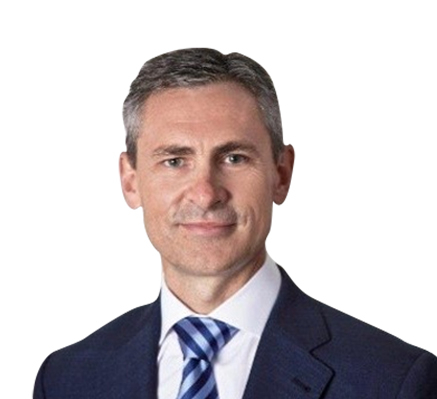
Javier Garcia Cuadrado
CHIEF INTERNAL AUDITOR
Appointment Date: 2023
Education: CIA (Certified Internal Auditor), COSO Internal Control, COSO Enterprise Risk Management, and TEIA (Technical Evaluator on Internal Audit); Executive Development (PDD), IESE – Madrid; Master in Financial Markets, Universidad Autónoma – Madrid; and Bachelor’s degree in Economics, Universidad Autónoma – Madrid.
Work Experience
Ossama Matta
CHIEF FINANCIAL OFFICER
Appointment Date: 2010
Education: Master’s degree in Business Administration from the American University of Beirut and CPA certificate
Work Experience
Nawaf Al-Gharabally
CHIEF TECHNOLOGY OFFICER
Appointment Date: 2020
Education: Bachelor’s degree in Engineering from Kuwait University
Work Experience
Nawal Hamad Bourisli
CHIEF PURPOSE AND HUMAN RESOURCES OFFICER
Appointment Date: 2018
Education: Completed a leadership development program at Harvard Business School.
Work Experience
Malek Hammoud
CHIEF INVESTMENTS AND DIGITAL TRANSFORMATION OFFICER
Appointment Date: 2017
Education: Bachelor’s degree in Electrical Engineering from the American University of Beirut, MBA from the London School of Business, and a Chartered Financial Analyst (CFA).
Work Experience
Kamil Hilali
CHIEF STRATEGY OFFICER
Appointment Date: 2018
Education: MSc. in Industrial Engineering from ENIM (Morocco), Master of Business Administration from Suffolk University (MA, USA), and Master of Finance from London Business School (UK) and professional Venture Capital training from Stamford University (CA, USA).
Work Experience
Mohammad Abdal
CHIEF COMMUNICATIONS OFFICER
Appointment Date: 2015
Education: Bachelor of Science in Business Administration with a double major in Finance and Information Management Systems from Portland State University, USA
Work Experience
Jennifer Suleiman
CHIEF SUSTAINABILITY OFFICER
Appointment Date: 2018
Education: Degree in Art History and Archeology from Washington University, Missouri, USA
Work Experience
Dr. Andrew Arowojolu
CHIEF REGULATORY OFFICER
Appointment Date: 2016
Education: Ph.D. in mobile wireless communication, Master’s in Microelectronics and Communication from the University of Liverpool, Bachelor’s in Electrical and Electronic Engineering from the University of Lagos, LLM (Master of Law) degree in Technology Media and Telecommunications Law (Distinction) from the Queen Mary University of London Center for Commercial Law Studies.
Work Experience
Firas Oggar
HEAD OF LEGAL
Appointment Date: 2017
Education: Master’s degree from the University of Paris in International Business Law
Work Experience

Venkatesh Jandhyala
CHIEF INTERNAL AUDITOR
Appointment Date: 2014
Education: Bachelor of Commerce and Law degrees from Osmania University, Hyderabad, India, a dual degree in Master of Science in International Finance and an MBA in Finance and Marketing from the University of Miami, USA, Chartered/Board Secretary diploma from India.
Work Experience
AbdulGhaffar Setareh
CHIEF RISK OFFICER
Appointment Date: 2016
Education: Telecommunications Engineering degree from Rabat, Morocco
Work Experience
Maryam Saif
CHIEF DIVERSITY, EQUITY AND
INCLUSION OFFICER
Appointment Date: 2017
Education: Master’s degree in Organizational Behavior and Bachelor of Science in Computer Programming from London Met University, Strategy Execution from Said Business School, University of Oxford.
Work Experience

Javier Garcia Cuadrado
CHIEF INTERNAL AUDITOR
Appointment Date: 2023
Education: CIA (Certified Internal Auditor), COSO Internal Control, COSO Enterprise Risk Management, and TEIA (Technical Evaluator on Internal Audit); Executive Development (PDD), IESE – Madrid; Master in Financial Markets, Universidad Autónoma – Madrid; and Bachelor’s degree in Economics, Universidad Autónoma – Madrid.
Work Experience
Board Nominations and Remuneration Committee (BNRC)
Please refer to Rule II of this report, which contains all information on the functions and achievements of the Committee as well as the composition and meetings.
Remuneration Report for the Board of Directors and Executive Management
Summary of the company’s remuneration and incentives policy, particularly related to members of the Board, Executive Management and managers.
The Board is responsible for creating the compensation policy, which establishes the foundation for the compensation structures of both the Board and executive management. This policy’s alignment with the company’s objectives and performance is of paramount importance. The policy is a manifestation of the company’s strategic aims and takes into account the principles of operational integrity and financial standing. This policy constitutes an integral component of the overarching corporate governance structure. The BNRC oversees the execution of this policy, as facilitated by the Board.
The Company’s remuneration policy was created in accordance with the following principles:
- Link rewards to the degree of risk
- Attract and retain the best professionals
- Ensure equality within the company and competitiveness outside.
- Comparison of market performance levels using analyses from specialized consulting firms
- Ensure transparency in awarding bonuses
- Link to performance indicators (KPIs) for Board members and Executive Management
- Be consistent with the company’s strategy and objectives, both long-term and short-term
- Match the experience and qualifications of the company’s employees at different employment levels
The company’s remuneration policy determines the reward system in line with the objectives of the company, shareholders, and stakeholders. This policy reflects standards and principles of best practices in good governance based on the relevant regulatory requirements.
The BNRC oversees policy implementation, conducts annual policy reviews, and ensures alignment with regulations like those from the CMA. Proposed policy changes are presented to the Board for approval. The Board is committed to fostering sound governance in the company’s compensation structure. Via the BNRC, it regularly updates the remuneration policy to align with the company’s strategy and risk framework. Executive management is responsible for designing the staff reward system per the approved policy and following up on implementing the strategy.
The KPIs are based on the company’s overall strategy and are approved by the Board. Executive Management implements this strategy and reports thereon to the Board regularly.
Board Remuneration
- The total Board remuneration shall not exceed 10% of the company’s net profits (after depreciation, reserves, and payment of dividends to shareholders not less than 5% of the company’s capital or any higher percentage, as provided in the Articles of Association of the Company).
- The Board remuneration is approved during the Annual General Meeting of shareholders as per the recommendations of the BNRC and by the Board itself.
- In 2023, the total remuneration granted to Board members was KD 478,500, which was approved by shareholders at the Annual General Meeting.
Executive Management Remuneration
Executive management’s remuneration system factors in the company’s operating environment, achievements, risk tolerance, and comprises the following essential elements:
Fixed Remunerations
- The determination of fixed remuneration hinges on the executive member’s level of responsibilities and their specific career path within the company. A remuneration index is established for each role, reflective of its value to the company.
- The BNRC, in collaboration with pertinent departments like human resources, conducts an annual review of fixed remuneration. This assessment considers the overall remuneration package, prevailing market conditions, and the performance of divisions across the company.
- Fixed remunerations, including salaries, allowances, and benefits (and end-of-service indemnity), are awarded under the approved salary and grading structure by the Board of Directors, the applicable laws and regulations and the manual of contractual agreements of employees issued by human resources.
Variable Remunerations
- Variable remunerations are intricately tied to the attainment of pre-defined objectives.
- This category of remuneration is strategically crafted to incentivize and recognize the efforts of Executive Management members. Variable bonuses are allocated based on both the individual performance of the Executive Management member and the holistic performance of the company.
- Within Zain, variable remuneration incorporates two distinct components: annual variable remuneration (awarded on a yearly basis) and multi-annual variable remuneration (distributed over multiple years, highlighting the Board’s focus on both short and long-term objectives).
- Annual objectives encompass two categories: financial indicators (pertaining to fiscal year financial targets for the company and its departments) and non-financial indicators (pertaining to operational objectives, achieved through activities and processes such as product launches, targeted investments, etc.).
Balance between fixed and variable remuneration
The company maintains a healthy balance between fixed and variable remuneration, enabling the option to decrease variable remuneration in scenarios of poor financial performance. The proportion of fixed and variable remuneration is evaluated and established annually by the Board, guided by recommendations from the BNRC.
*Details of the segments and types of remuneration and benefits mentioned are examples without limitation
*Details of the segments and types of remuneration and benefits mentioned are examples without limitation
There are no material deviations from the remuneration policy approved by the Board of Directors.
Safeguard the Integrity of Financial Reporting
Written pledges by both the Board of Directors and the Executive Management of the integrity of the financial statements
Please refer to the financial statements section in the 2023 annual report.
Board Audit Committee
Please refer to Rule II of this report, which contains all information on the functions and achievements of the Committee as well as the composition and meetings.
In the event of a conflict between the recommendations of the Audit Committee and the decisions of the Board of Directors, a statement will be included detailing and clarifying the recommendations and the reason/s behind the decision of the Board of Directors not to abide by them.
There were no inconsistencies between the Audit Committee recommendations and the decisions of the Board of Directors during 2023.
Emphasizing the independence and impartiality of the external auditor
The independence and impartiality of the external auditor are crucial to ensure unbiased and accurate assessments of a company’s financial statements and operations. This integrity helps maintain investor confidence, supports transparent reporting, and upholds the credibility of financial information.
The Companies Law and the CMA regulations stipulate specific requirements that external auditors must meet when preparing their audit reports and verifying the accuracy of company reports. Zain is committed to having the external auditor be independent of the company and its Board and not perform actions that may affect impartiality and independence. Therefore, the Audit Committee shall recommend the appointment, reappointment or change of the external auditor to the Board, including determining their fees and reviewing their appointment letters. The external auditor is officially appointed at the Ordinary General Assembly based on the recommendations of the Board while fulfilling the following requirements:
- The external auditor is a licensed auditor by the CMA and has fully met all registration requirements stated by the CMA
- The external auditor is independent and does not perform additional tasks that may affect neutrality and independence
Audited financial statements play a vital governance role by providing an objective and reliable assessment of a company’s financial health and performance. They enhance transparency, aid in regulatory compliance, and bolster stakeholders’ trust, fostering effective oversight and decision-making. The company’s accounting system aims to identify, compile, classify, analyze, record, and report on the company’s transactions and maintain accountability for assets.
One of the key responsibilities of the external auditor is to thoroughly assess and validate the precision of the company’s financial statements. This involves ensuring adherence to applicable regulations, laws, and standards. The external auditors provide their professional assessment on the equity of Zain’s financial position, operational outcomes, and cash flows. Additionally, they validate the appropriateness of the company’s chosen accounting principles and evaluate associated risks.
To facilitate a comprehensive audit process, the Board ensures that the external auditors are adequately equipped with the necessary time, resources, and expertise to grasp the intricacies of the business and its operations. Part of this process involves the examination of the opinion letter provided by the independent auditor. The Board takes a proactive stance in addressing all observations outlined in this letter, ensuring effective collaboration with executive management.
The external auditors meet with the Audit Committee quarterly; additionally, they have the right to request a meeting with the Committee when necessary, without the presence of executive management. The Board must call for a General Assembly meeting based on a request from the external auditor within 15 days from the date of the request. The external auditors attend the meetings of the General Assembly and read their report to shareholders, explaining any obstacles or interferences from the Board during the performance of their duties. The auditors must also inform the CMA of any material violations or obstacles and their details.
Accordingly, Deloitte and Touche (Al Wazzan & Partners) has been appointed to perform the functions required by the independent external auditor. We would like to confirm that Deloitte is not providing any additional services for Zain.
About Deloitte & Touche (Al Wazzan & Partners)
Deloitte & Touche, with its approximately 286,000 professionals, enjoys a globally connected network of member firms in more than 150 countries where it provides audit, consulting, financial advisory, enterprise risk services, tax. Deloitte & Touche (M.E.) is a member firm of Deloitte Touche Tohmatsu Limited (DTTL) and is the first Arab professional services firm established in the Middle East region with uninterrupted presence since 1926 with more than 5,900 staff working in over 26 offices in 15 countries in the Middle East.
In Kuwait, Deloitte & Touche Al Wazzan & Co. has a strong audit practice serving leading enterprises and institutions in telecommunications, banking, aviation, insurance, construction, trading, manufacturing, energy, and resources. The Kuwait audit practice has approximately 10 partners, principals and directors, and more than 103 dedicated audit professionals.
Auditors’ Fees
The total fee for audit and other assurance services for the Group and its subsidiaries amounts to KD 1.113 million (2022: KD 1.001 million).
Apply Sound Systems of Risk Management and Internal Audit
A brief statement on the implementation of the requirements for the formation of an independent department/office/unit for risk management:
We have diligently executed the prerequisites for establishing a risk management department that functions independently in strict accordance with corporate governance standards. The Chief Risk Officer (CRO) oversees this department with substantial independence, resources, and direct access to the Board of Directors. This department is vested with the responsibility of identifying, evaluating, and supervising the array of risks inherent to our organization. In alignment with the widely recognized Three Lines of Defense framework for risk management, an autonomous risk function stands as a pivotal element within the company’s second line of defense. This department assumes the duty of recognizing, assessing, and overseeing the variety of risks inherent to the organization. Under the approved company’s organizational structure, the Risk Management department reports to the BRC, conforming to relevant legal and regulatory mandates.
Board Risk Committee
Please refer to Rule II of this report, which contains all information on the functions and achievements of the Committee as well as the composition and meetings.
Internal Control Systems
Defining values, principles, and roles is pivotal for informed decision-making. Implementing our code of conduct and internal policies is vital for efficient, ethical, and legal operations. Thus, we prioritize adherence to applicable laws, guidelines, and practices through robust external and internal controls. These systems safeguard stakeholder rights and bolster our objectives and strategic pursuits.
OUR VISION
“to become the leading provider of innovation and digital lifestyle communications by providing the best and simplest experience for our customers”
OUR VALUES
Heart
The courage to make the choices that makes this a better world
Radiance
Putting inspiration at the center of our powerful leadership
Belonging
Breaking boundaries and bringing people together
INTERNAL CONTROL FRAMEWORK
Three-line defense
- Internal Audit
- Risk Management
- Corporate governance and compliance
Defined Responsibilities
- Independent functions
- Quality and Integrity
- Assignment of roles per governance principles
Control Environment
- External factors that shape the internal control environment such as laws, regulations, charters and international standards
- Independent registered external auditors
Risk Assessment
- Compliance risks
- Market risks
- Operations risks
Awareness
- Policies
- Procedures
- Code of conduct
- Technical tools and software
- Training
External mechanisms for control and oversight
External control mechanisms are overseen by entities external to the organization, encompassing regulatory bodies, government agencies, independent auditors, and other pertinent bodies. These mechanisms predominantly aim to evaluate adherence to legal frameworks, regulations, and optimal practices.
Within this context, Zain voluntarily undergoes an independent audit to evaluate its holistic corporate governance structure. The company is subject to rigorous oversight and examination by several authoritative bodies, including the CMA, the Ministry of Commerce and Industry, the Anti-Corruption Authority, the Competition Protection Agency, and the Communications and Information Technology Regulatory Authority (CITRA), along with relevant governmental and regulatory entities in all operational jurisdictions.
The CMA undertakes diligent supervisory inspections, closely monitoring corporate activities in alignment with pertinent legislation. Consequently, the company’s operations undergo comprehensive audits, yielding detailed reports incorporating compliance status, implementation efficiency, and any necessary adjustments, breaches, or corrective actions. Furthermore, all corporate records are subject to scrutiny and auditing under the purview of the CMA.
In accordance with both the Kuwaiti Companies Law and international accounting standards, Zain is obligated to designate an auditor during the Ordinary General Assembly. This appointment occurs subsequent to a recommendation put forth by the Board of Directors, alongside endorsement from the Audit Committee of the Board.
The chosen auditor must not simultaneously hold the position of Chairman or Board member within the same company whose financial records they are entrusted to audit. Additionally, they cannot occupy an executive role within the company, engage in overseeing its accounts, or maintain any direct kinship up to the second degree with individuals involved in the company’s management or account supervision. Furthermore, the appointed auditor is barred from acquiring shares in the entities whose financial records they audit. It is also a stipulation that the auditor abstains from purchasing or selling company shares throughout the auditing period while actively providing advisory services to the company. Adherence to these regulations ensures the integrity and impartiality of the auditing process.
The auditor has the right, at all times, to review all the company’s books, records, and documents and to request the data he deems necessary. The auditor or his delegate must attend the ordinary general assembly meetings and submit a report on the company’s financial statements. The report shows the financial position of the company at the end of the fiscal year and the results of the company’s business operations for that year. It also includes a statement on whether the data contained in the report of the Board and the company’s books are compatible with generally accepted accounting principles and what is stipulated in the law. The Board or a number of shareholders representing 25% of the capital may request the replacement of the auditor during the fiscal year.
Internal controls systems
The Board understands the complex landscape of risks inherent to the company’s operations, including the scope of risks that pass through environmental, social, and governance domains. Maintaining an unwavering vigilance, the Board remains committed to mitigating the company’s exposure to these risks. Collaboratively engaged with executive management, the Board decides a course of action to deal with these risks. The Board’s role extends to the identification of both internal and external relevant factors that highlight these risks. With strategic policies and tactics, the company’s risk appetite outlines the framework within which these identified risks are to be addressed. A pivotal cornerstone within this intricate structure is the company’s internal controls, fixed to amplify stakeholder value and foster the attainment of strategic objectives.
This network of controls not only aligns operations with best practices, statutes, and regulations but also serves as a support for risk management. These systems serve as the foundation for the establishment of a robust internal control framework and as a channel through which strategic objectives are achieved. This ensures the delivery of dependable financial reports to both internal and external stakeholders, supports operational efficiency, guarantees legal compliance, and secures corporate assets.
The following list contains key procedures taken by the company to ensure adherence to integrity and ethical values:
- The company’s organizational structure takes into account the Four Eyes Principle
- The Internal Audit Department is independent as it reports to the Board Audit Committee. One of the responsibilities of this department is to audit the company’s operations and procedures, to ensure compliance with relevant laws, policies, and standards, and to identify areas that can be modified
- Assigning an independent audit office to evaluate and review the internal control systems and to prepare a report to be submitted to the CMA on an annual basis
- An independent auditor reviews and evaluates the performance of the Internal Audit Department every three years; a copy of the findings report is provided to the Board Audit Committee and the Board of Directors.
- A registered independent auditor provides limited independent assurance of the sustainability report
Zain’s control environment relies on the dedication to upholding integrity and ethical principles. This commitment extends to preserving the independence of the Board of Directors in relation to executive management, as well as their vigilant oversight of internal controls within the company. Zain’s environment is further characterized by the establishment of a well-defined organizational structure, administrative hierarchy, and clear delegation of authority and responsibilities to effectively monitor progress towards business objectives. Furthermore, a key aspect of this control environment is the unwavering dedication to attracting, nurturing, and retaining top talent. Simultaneously, there is a commitment to ensuring accountability throughout the organization for the implementation of robust internal controls.
The framework of internal control systems includes a collection of policies, procedures, standards, and protocols designed to uphold organizational governance. The Board assumes the responsibility for shaping the structure and parameters guiding executive management in the company’s operational landscape. These internal policies and procedures have garnered the Board’s endorsement, ensuring their alignment with shareholder and stakeholder rights, ethical codes, applicable laws, regulations, and industry benchmarks.
Furthermore, the Board undertakes a comprehensive annual assessment of risks, supplemented by evaluations triggered by substantial shifts in company dynamics, market conditions, or regulatory standards. Consequently, the policies and procedures comprise control mechanisms tailored to mitigate these identified risks. The Audit Committee assumes the key role of analyzing the adequacy of internal control systems in the company. In line with this authority, the committee conducts a comprehensive appraisal, concluding in a report that contains its insights, judgments, and recommendations on the effectiveness of said systems.
The efficient control environment at Zain allows the members of the Board and executive management to understand their responsibilities and the limits of their authority. The employees in this environment are also committed to following the company’s policies, procedures, and code of conduct. The control environment also includes technical competency and ethical commitment.
In a proactive stride towards strengthening our control environment, the Board has formulated and published written protocols, including policies, procedures, codes of conduct, and standards of behavior. The overarching objective of these measures is to cultivate a culture of ethical behavior, instilling a positive culture that demands uniform adherence to these standards across all tiers of our organization. Furthermore, our executive management champion unwavering integrity and elevated professional benchmarks. Their leadership approach serves to reinforce our internal control mechanisms, fostering a robust framework that resonates throughout the company.
The Board guarantees the appropriate segregation of duties and procedures, maintaining documents and records, and assessing performance by independent bodies. Conducting independent checks on performance is a valuable control method. Based on the regulations and instructions by the CMA, the company appointed AlBazie & Partners, an independent auditing firm, to assess and review internal control systems. The Internal Control Review (ICR) includes a complete assessment of the company’s internal control system to determine whether the company’s functions and departments are operating as intended and whether they can manage the risks that the company may face in its day-to-day operations. The Internal Control Review (ICR) is vital to governance as it ensures risk mitigation, operational efficiency, transparency, compliance, fraud prevention, stakeholder confidence, and informed decision-making, thereby upholding accountability and facilitating sustainable organizational growth.
The ICR provides stakeholders, including shareholders, regulators, and the Board, with an overview of the effectiveness of the internal control environment. It highlights weaknesses in the company’s internal control environment and identifies processes that can be improved.
The procedures of the Internal Control Review involve assessing documentation, identifying risks, evaluating processes, conducting control tests, verifying compliance, analyzing data, interviewing management, reporting findings, making recommendations, and promoting ongoing improvement. The findings and recommendations are shared with the Board and the CMA.
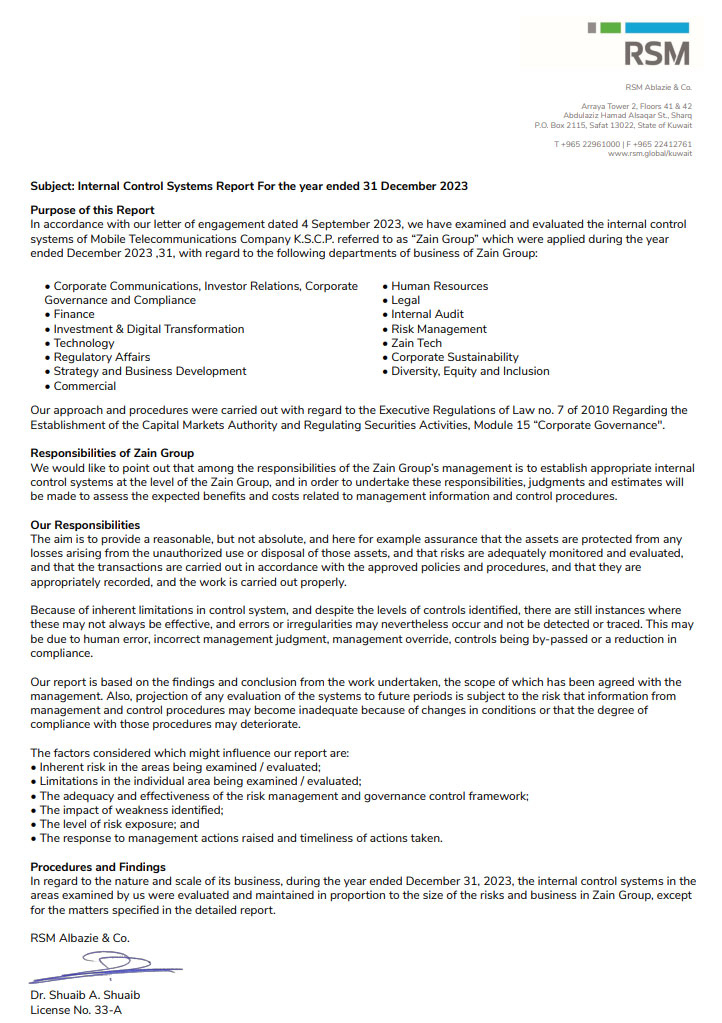
A brief statement on implementing the requirements for forming an independent department/office/unit for internal audit
In alignment with corporate governance laws and regulations in Kuwait, establishing an independent internal audit department necessitates thorough adherence to regulatory guidelines. This involves defining the department’s scope, formulating strong internal audit procedures, appointing qualified personnel, ensuring independence from operational functions, reporting directly to the Board Audit Committee (BAC), and upholding a consistent evaluation process to verify compliance and effectiveness. Such implementation reinforces transparency, accountability, high ethical standards, and effective risk management within the organization’s governance framework. The Internal Audit Department operates independently. It falls under the supervision of the Chief Internal Auditor and reports to the BAC. In addition, the BAC is concerned with supervising financial reporting, risk management, and internal control, and is also responsible for submitting recommendations to the Board regarding the appointment of an external auditor.
The requirements to form the Audit Committee and define its responsibilities in the organization comply with the relevant laws and regulations issued by the CMA and the Ministry of Commerce and Industry, which greatly enhanced the role of audit committees in the governance framework. The extent of the Audit Committee’s role and duties is evident through its responsibilities (for details on the role and responsibilities of the committee, please see the second rule of this report). Internal audit is an independent, objective assurance and advisory activity designed to add value and improve the company’s operations. The Internal Audit department helps achieve the company’s objectives by providing a structured and disciplined approach to assessing and enhancing the effectiveness of risk management, internal control, and governance processes.
In line with our mission, the Internal Audit department provides the executive management, Risk Committee and the Board of Directors with information, assessments, recommendations and advice regarding the audited operations and other critical and ethical issues. Internal audits are conducted throughout all areas of the company’s operations.
The primary responsibilities of the internal audit function can be summarized as follows:
- Evaluating the adequacy of the internal control systems
- Recommending improvements in controls
- Assessing compliance with policies, procedures, and sound business practices
- Conducting a thorough assessment of compliance with all approved policies and ethical standards
- Evaluating compliance with laws, guidelines, and regulations
- Examining operations to determine whether results are consistent with established objectives and whether processes are being carried out as planned
- Working closely with departments to identify and evaluate risks and controls without compromising the principle of independence
- Preparing an internal audit work plan based on a systematic risk assessment, including the risks/control issues identified by the executive management, the Audit Committee and the Board
The Chief Internal Auditor issues reports to the Audit Committee and the Board while carrying out the tasks and responsibilities assigned to the management. The Chief Internal Auditor meets with the Audit Committee of the Board periodically to report on the plans and results of the audit function and provide any other information required. In addition, he has direct access to the Chairman and the Board in matters of pressing importance.
Promote Code of Conduct and Ethical Standards
Professional Conduct and Values
Promoting a Code of Conduct and ethical standards within a company under corporate governance principles requires a strategic and comprehensive approach. Here’s how Zain effectively achieves this:
- Leadership Commitment: The Board of Directors and executive management lead by example, demonstrating unwavering commitment to ethical behavior. Their actions and decisions set the tone for the entire organization.
- Clear Communication: The company has approved a well-defined and accessible code of conduct for the Board, management, employees and suppliers. The Code of Conduct outlines the company’s values, expectations, and ethical guidelines. Our Code of Conduct sets out what we expect from all parties, such as the Board, Executive Management, employees, suppliers, and partners. This document is widely communicated to all employees, stakeholders, and partners and is published on the website.
- Incorporate into Performance Evaluation: Adherence to the Code of Conduct and ethical standards is tied into performance evaluations and recognition systems. This reinforces the importance of ethical behavior in career progression.
- Whistleblower Protection: The company implemented a confidential and safe mechanism for reporting ethical violations, such as an anonymous whistleblower form. This ensures security when reporting misconduct.
- Transparency and Reporting: Annual reports and updates that highlight the company’s efforts to uphold ethical standards are published on the website. This demonstrates accountability and progress to stakeholders.
- Incorporated in Decision-Making: Zain integrates ethical considerations into decision-making processes and encourages employees at all levels to question and evaluate decisions from an ethical standpoint.
- Third-Party Audits: Zain periodically engages external auditors to assess the company’s adherence to ethical standards and the effectiveness of its internal controls.
- Supplier and Partner Engagement: Zain extends ethical standards to suppliers, contractors, and partners and collaborates with them to ensure alignment with the company’s ethical expectations. (Refer to the Supplier Code of Conduct on the company’s website.)
- Continuous Improvement: Zain regularly reviews and updates the Code of Conduct to reflect changing industry norms, regulatory requirements, and stakeholder expectations.
- Accountability Measures: We clearly define consequences for violating the Code of Conduct and ensure that disciplinary actions are fair, consistent, and aligned with company policies.
By implementing these strategies, Zain can effectively foster a culture of ethics and integrity, ultimately contributing to its long-term success and sustainability under the principles of corporate governance.
The company is firmly committed to the United Nations Universal Declaration of Human Rights (UDHR), the Core Conventions of the International Labor Organization (ILO) and the OECD Guidelines for Multinational Enterprises.
By doing so, we can have a positive and long-term impact, as corporate sustainability provides key competitive advantages. Zain does not rely on mere adherence to legal minimums, but as an industry leader, we aspire to be among the best in global sustainability practices. To achieve this, the Board, executive management, and all parties at Zain are committed to the highest human rights and labor standards and establishing a sound environment and good governance practices in all business activities.
Personal Data Protection and Privacy
Zain and its subsidiaries and affiliates are subject to laws, regulations, charters, and resolutions enacted and promulgated by the relevant legislative bodies and regulatory authorities in each respective jurisdiction. In addition, Zain complies with international standards such as those issued by the Sustainability Accounting Standards Board (SASB) and the International Standards Organizations ISO/IEC 27001 information security management standard.
The protection and privacy of personally identifiable information (PII) entrusted to Zain by customers, clients, employees, suppliers, stakeholders, local and international strategic partners, and other individuals Zain works with are paramount to the organization. Accordingly, we are committed to protecting and respecting the privacy of all data subjects who engage with the company securely and transparently to comply with applicable legislation.
Zain embeds its privacy administration processes in its Group-wide regulatory compliance management and risk evaluation program, which actively supports the implementation of the company’s ‘4Sight’ strategy. The overarching privacy policy at Zain sets out the broad principles and guidelines for collecting, processing, storing, and disclosing personal data in line with applicable laws and regulations. We also issue privacy notices on the websites of all Zain operating companies. These privacy notices are regularly updated, provide information on the latest country-specific data protection laws and regulations, and outline any country-specific mandates we further implement to protect your data. Please refer to the company’s website to view the full data protection and privacy policy. The policy is approved by the Board.
Human Rights
Zain is committed to respecting human rights as defined in the Universal Declaration of Human Rights, the International Covenant on Civil and Political Rights, and the ILO Declaration on Fundamental Principles and the Rights at work. The policy is also guided by the United Nations Guiding Principles for Business and Human Rights, the UN Convention on the Rights of Persons with Disabilities, the UN Convention on the Rights of the Child, the Guidelines of the Organization for Cooperation and Economic Development for Multinational Companies, and it is in alignment with the principles of the United Nations Global Compact and the Global Network Initiative’s principles on Freedom of Expression and Privacy – GNI Principles. This policy applies to all Zain operating companies and those entities under Zain Group management control. The policy also applies to all our suppliers and business partners. Our suppliers are expected to adhere to the Zain Group Supplier Code of Conduct and the Zain Group Human Rights Policy. Zain is committed to monitoring this policy’s implementation through its internal processes overseen by Group Sustainability, Group Risk Management, Group Corporate Governance and Group Legal, whose mandate is to report on a transparent basis the progress made on human rights issues to the Board. In addition, human rights issues are communicated in Zain’s Annual Corporate Sustainability Report.
Conflict of Interests
Zain’s governance framework includes a set of policies aimed at protecting the rights of shareholders and other stakeholders. This framework includes the conflict-of-interest policy that defines employee actions when there is a potential conflict between their personal and the company’s interests. The policy also sets limits for employees where possible conflicts may arise.
Board members and executive management at Zain are obligated to disclose every actual or potential case of conflict of interest, as defined within the company’s policy based on relevant laws, regulations, and international standards. Zain’s conflict of interest policy includes clear examples of cases of conflict of interest and the methods of addressing and dealing with them. A conflict of interest occurs when an individual’s interests influence their judgment, decisions, or actions in a way that negatively affects their professional commitments or responsibilities and raises questions about whether their decisions can be unbiased. Accordingly, Zain includes conflict of interest in its policies, procedures and charters and treats every case with top priority.
Board members are also obligated to disclose any personal interest in the business and contracts for the company’s account. This disclosure is recorded in the minutes of the meetings. The Board member with personal interests in the topic at hand refrains from participating in voting on the relevant resolution. If a Board member has a personal interest, a special report from the auditor shall be attached to this disclosure.
According to the CMA executive bylaw, the company assigns an independent expert to submit a report to the General Assembly or the Board regarding any transaction or any arrangement whereby each of the parties enters into any project or buys an asset or provides financing for it when the value of the transaction or arrangement is equivalent to 10% or more of the company’s total assets. Such reports are submitted before the deal or agreement is approved.
The policy is based on several principles, such as protecting the rights of stakeholders and maximizing shareholders’ value. In addition, it emphasizes maintaining the confidentiality of transactions and information issued by the Board.
Sanctions
Zain Group has developed a sanctions policy in line with applicable sanctions laws and regulations. This policy summarizes the precautions imposed by the sanctioning authorities that control the company’s ability to conduct any activity in some high-risk regions or with sanctioned persons. This policy also sets out restrictions and measures which must be followed by every employee in the company consistently. The company is committed to complying with the sanction laws and regulations in all the countries in which it operates; this aligns with its strategy and vision as the most trusted network provider.
This policy covers the effects of non-compliance with the sanctions laws and regulations and the process for reporting such violations.
Anti-Corruption
The Board has adopted an anti-corruption policy within the framework of corporate governance at Zain. The anticorruption policy sets out the principles which Zain and its subsidiaries follow, based on zero tolerance for bribery and corruption. This policy aims to ensure appropriate measures are in place to combat corruption and bribery in all company operations to avoid any violations of relevant laws and regulations.
Zain Group strictly prohibits offering, authorizing, or receiving bribes under any circumstances, including bribery of individuals and government officials. Such actions are unethical and illegal. We strive to succeed with honesty and fairness, relying on our excellent performance and ethical business practices. We are committed to conducting our business activities with integrity, in line with our company Code of Conduct. This policy is communicated to all stakeholders, promoted, and supported by awareness and training initiatives, to ensure full understanding and compliance by all stakeholders.
The policy has been prepared under laws and regulations and covers various topics, including business conduct, giving and receiving gifts, doing business with a third-party, political and charitable contributions (Zain does not provide financial support to political parties and affiliations), financial facilities, non-controlling ownership percentages, commitment to maintaining accuracy and integrity in keeping company records, reporting and disciplinary measures in case of policy violation, conflict of interest, related party transactions, economic sanctions and anti-money laundering.
Anti-Money Laundering (AML)
Zain’s commitment to the highest ethical and legal standards extends to its business operations across all countries. Accordingly, Zain Group takes all necessary measures to prevent money-laundering activities within its footprint. The Board approved this policy to ensure that Zain is committed to complying with all requirements of relevant Anti-Money Laundering and Counter-Terrorist Funding Laws, Regulations and Standards. This policy aims to ensure the completion of risk-based controls that prevent the misuse of Zain Group assets by money launderers and those involved in financing terrorism. It also protects Zain, its employees, and stakeholders from involuntarily committing money laundering and terrorist financing violations.
Diversity, Equity, and Inclusion
Zain’s Board is committed to the diversity, equity, and inclusion (DEI) principles starting with the principles behind the composition of the Board, which is in line with the size and geographic spread of Zain, its portfolio, culture, and status as a listed company. The company recognizes the importance of a diverse Board in providing a range of opinions in the decision-making process, which is beneficial to the company’s long-term success and protects stakeholder rights. When selecting Board members, the process is based on reasonable criteria, and there is no discrimination on any personal or physical attributes that do not speak to a person’s ability to perform as a member. The Board supports Zain’s DEI approach and management efforts to ensure that the diversity of the Board and Executive Management is continuously enhanced.
The Board approved this policy which aims to promote diversity on the Board in terms of experience and knowledge regardless of gender, race, ethnic origin, disability, age, nationality, national origin, religion/belief, marital status, and social class. Zain Group opposes all forms of discrimination. This policy is largely set up to address the importance of a diverse Board in employing the unique identities, skills, and experiences of the members in a way that collectively benefits the company.
Zain is proud to be among the first telecom providers in the region to have established a DEI department to indicate how seriously the company uplifts our entire workforce and benefits society.
This DEI department adopts a series of carefully prepared programs and initiatives in more than one field, such as programs for gender diversity, a program for people with special needs, a program for youth empowerment, and an internal innovation platform (helping Zain employees to turn their ideas into startups of their own) and programs for mental health. As Zain believes its employees represent its greatest asset, it takes pride in its continuous efforts to support its employees. While Zain Group continues its programs and initiatives to enhance its workforce, it seeks at the same time to harness the power of this diversity to build a business model that inspires others and sets an example in the labor markets looking for a change. Details of DEI’s initiatives and policies are available on the company’s website.
Ensure Timely and High-Quality Disclosure and Transparency
Disclosure mechanisms and characteristics
Zain adheres to the rules and guidelines of disclosure and transparency according to the Disclosure and Transparency Module issued by the CMA. The following are the most important policies concerned with ensuring transparency in the company’s operations:
Disclosure policy
The company’s governance framework includes a disclosure policy through which it ensures the accurate, realistic, and timely disclosure of all material information related to the company, including financial position, performance, ownership, and corporate governance. The policy aims to enhance the company’s ability to comply with the rules, laws, and instructions issued by the CMA and other relevant regulatory bodies while ensuring fairness and equality in providing the right to access that information.
The policy defines a framework for the proactive disclosure of information related to the company. It emphasizes achieving a balance between the confidentiality required by our customers with the information needed by stakeholders such as shareholders, regulators, and analysts. This policy aims to provide the necessary information to all stakeholders, whether they are employees, customers, members of society or the general public. This policy defines the principles and requirements of transparency and the types of information that will be disclosed to ensure that stakeholders are treated fairly. The Board monitors the disclosure process and communicates with internal and external stakeholders. A set of the company’s internal policies has been published on the official website after the approval of the company’s Board to provide a clearer picture of the company’s internal processes, policies and procedures, which leads to a deeper connection with shareholders and other stakeholders and reaching the highest levels of trust with different groups of stakeholders. The Corporate Governance and Compliance Department is responsible for supervising the disclosure process in accordance with the requirements of the CMA to ensure full compliance by the company with the instructions contained in Module Ten of the CMA’s executive bylaw on disclosure and transparency.
Accordingly, the Corporate Governance and Compliance Department works to provide any clarifications related to disclosure requirements. This department is the main point of contact responsible for communicating with and responding to the inquiries of the CMA and the relevant regulatory authorities.
Data protection and privacy policy
The company is legally and ethically obligated to protect customer information to ensure that it is not misused in a way that harms the customer’s interests or the company’s reputation. All employees are responsible for protecting customer information and not disclosing any information they are not authorized to disclose, following the relevant regulatory requirements. All employees are fully aware of all policies related to data protection, distribution, transmission, preservation, or disposal.
Disclosure archive
All public disclosures are posted on the company’s website; with the approval of the Corporate Governance and Compliance Department and in cooperation with the Corporate Communications and Investor Relations Departments, the company utilizes its website to communicate with stakeholders (shareholders, investors, customers, regulatory authorities, etc.) and distribute company information that is required to be published. The information available on the website includes annual reports, quarterly reports, financial information, and market disclosures (for more than 12 years) and other information.
Insider Trading Policy
Zain establishes adequate contractual arrangements that require insiders who have access to internal information about it and its customers to maintain the confidentiality of such information, not misusing it, transferring it or causing it to be transmitted directly or indirectly to other persons, and not urging other persons to deal in securities based on such inside information. In addition, Zain maintains a permanent record of the insider’s trades. Accordingly, Boursa Kuwait is obligated to receive the insiders’ watchlist and to verify that the people whose names appear in that list comply with the provisions of applicable laws and regulations when trading in securities. Boursa Kuwait is also obligated to consider the adherence of the insiders of the listed company not to trade during the prohibition periods indicated in the regulations and to announce all disclosures received accordingly.
Disclosures record for the Board of Directors and Executive Management
The company maintains a record that includes all the disclosures of Board members and Executive Management. The company is committed to updating this record according to the disclosures issued to ensure accuracy.
The company also maintains a record that includes the disclosures of the insiders. The information and disclosures are kept within the internal electronic library that facilitates the availability of information to the concerned parties at the appropriate time.
The company’s official website contains a record that includes all the company’s disclosures to the market that date back more than ten years.
Investor Relations (IR)
Zain is committed to providing information and reports to shareholders and potential investors through the Investor Relations (IR) department. The Board has approved an IR policy that confirms compliance with applicable laws, rules, and instructions, that covers all employees of the company and the company’s board of directors. The IR policy includes all means of communication with shareholders, potential investors, analysts, and the media; this includes annual and quarterly reports, news, prospectuses, memoranda for shareholders, press releases held by official spokespersons, and information on the company’s website.
The most important principles of this policy are protecting shareholders’ rights, communicating with shareholders, and issuing disclosures to shareholders. Accordingly, important information is made available to shareholders through appropriate means of disclosure such as periodic reports, annual reports, the company’s website, Boursa Kuwait website, quarterly communication with analysts and relevant conferences, etc.
The responsibility for implementing this policy lies with the employees of the IR Department, in addition to other stakeholders in the company. This department plays a vital role in ensuring the protection of shareholders’ rights by the company. The IR department includes multiple competencies and expertise, which ensures easy and continuous communication with shareholders, potential investors, analysts, and the media.
The main objectives of Investor Relations
- Establish consistent and reliable communication channels with investors in compliance with relevant regulations and laws, including those issued by the CMA and the Commercial Companies Law of the State of Kuwait
- Strengthen the company’s position in the market and attract shareholders and investments
- Establish a link between executive management and the financial community to strengthen the relationship of executive management with analysts and stakeholders
- Provide financial and non-financial information related to the company to the Board of Directors, executive management, shareholders, and analysts.
Following the disclosure of the financial statements, the IR department organizes a call between Executive Management and analysts to discuss the results of the company’s financial statements and open the door to any inquiries that analysts may have regarding the company’s performance. The transcripts of these calls are available on the company’s website to be a reference for shareholders and the public in both Arabic and English.
The IR team and Executive Management attend IR conferences to attract potential investors’ interest and hold individual meetings with local and international potential investors and existing shareholders. All executives attending these conferences are fully prepared to answer any questions or inquiries raised during the meetings, provided that these meetings meet all relevant regulatory requirements.
The IR department is responsible for assembling the company’s annual report, including requesting input from relevant departments. In addition, the IR team reviews the content received from these departments and ensures its consistency with the company’s strategy and approved public image.
Key highlights of the year 2023 for the Investor Relations Department:
- Achieved a significant accomplishment by elevating foreign ownership to 15.4% by the end of the year 2023, a record high international ownership since inception.
- Participated in two different Corporate-Days, hosted by HSBC and Boursa Kuwait (targeting different geographical markets – London & Dubai).
- Nominated as “Best IR Corporate and Professional Award” in the region by Middle East Investor Relations Association (MEIRA)
IT infrastructure and disclosure processes
- The company’s website includes all the disclosures that date back more than ten years. The website also includes periodic financial reports, analyst reports and other facts and indicators.
- The website contains information about the Board, executive management and the company’s code of conduct, and the main principles and values that support the company’s operations.
- Zain IR App: Developed in 2017, it is a comprehensive platform that caters to all IR activities and publications of the company. The Zain app primarily focuses on disseminating key information to stakeholders, such as company financials, shareholders’ presentations, earnings calls and management transcripts. Additionally, it provides updated share price information, dividend details, and analysts’ consensus to ensure investors are well-informed about Zain’s performance. The app also features an updated calendar that lets users track all the upcoming events related to Zain, ensuring that they do not miss any significant announcements. The Zain IR App is a crucial tool. It enhances the transparency and efficiency of all IR activities, ultimately leading to better communication with investors and greater value creation for all stakeholders.
- The CMA is addressed by e-mail (in addition to mail) to provide the required information and disclosures.
- Communication with the CMA takes place through the CMA’s electronic portal, which was established to facilitate the transactions of the entities covered by its supervision and enhance and raise work efficiency in an electronic environment.
- The company follows the electronic system of disclosures through the Boursa Kuwait website to update disclosures and data.
- The company submits all required documents, such as the company’s annual financial statements, the request, and other requirements necessary for holding the AGM, through the online platform provided by Kuwait Clearing Company. Moreover, all requests and inquiries by stakeholders are also received electronically by the Ministry of Commerce. Additionally, the platform facilitates other procedures and services.
- As listed in the Premier Market, Zain uses the electronic system provided by the Kuwait Clearing Company to hold its AGM and enable the companies’ shareholders to participate in the shareholders’ meetings without attending in person.
- The company’s intranet includes an electronic library that contains all the details and information, which are easily accessible at any time with the correct credentials.
Respect the Rights of Shareholders
Summary of shareholders ’meetings during the last three years
Equal Treatment of Shareholders and Protection of Shareholders’ Rights
The company is committed to ensuring that all shareholders exercise their rights fairly. In addition, the company is committed to protecting shareholders’ assets from any misuse by the Board, executive management, or key shareholders. The company treats all shareholders of the same class equally and without discrimination, in line with the company’s interests, and following the laws and regulations. The company is committed to providing the following rights to the shareholders:
- Recording the ownership value in the shareholders’ register with Kuwait Clearing Company (KCC)
- Disposal of shares through registration of ownership and/or transferring
- Receipt of cash and share dividends
- Acquiring a share of the company’s assets in case of liquidation (after payment of all debts of the company)
- Obtaining data and information about the company’s business and operational and investment strategy regularly
- Participation in meetings of the General Assembly of shareholders and vote on its decisions
- Election of Board members
- Monitoring the performance of the company in general and the work of the Board in particular
- Accountability of Board members or Executive Management if they fail to perform the tasks assigned to them
Shareholders also receive information and data following the laws. Shareholders are entitled to access the information contained in the Company’s disclosure records. As part of the company’s corporate governance framework, the protection of shareholders’ rights policy has been developed to ensure the company’s commitment to respecting and protecting the rights of all shareholders per the relevant laws and regulations. In the provisions of the regulations and instructions issued by the regulatory authorities, this policy applies to the company, its subsidiaries, the board of directors, the executive management, and all employees about their role in protecting the rights of the shareholders.
Shareholders’ Register at the Kuwait Clearing Company (KCC)
In April 2004, Zain signed an agreement with the Kuwait Clearing Company (KCC) to maintain a record of its shareholders with the KCC. Accordingly, the KCC provides the following:
- Create an index for all shareholders, which includes the names, trading numbers, number of shares and nationalities.
- Update the data according to all trading activities on Boursa Kuwait
- Perform all procedures for transfer of ownership in addition to buy/sell transactions after obtaining all the required approvals from the regulatory authorities
- Track procedures for lost/damaged certificates and the related issuance of new ones
- Distribute cash dividends and stock splits
- Provide the company with shareholders’ balance reports on a daily/monthly basis
- Provide the company with unclaimed dividend reports monthly
- Distribute outstanding share certificates, issue new shares for heirs, and register them
- Record mortgage transactions on the company’s shares
- Prepare AGM invitations in coordination with the company
- Allow shareholders to obtain the company’s information or documents in compliance with laws and regulations
Shareholders’ voting and participation at the AGM
The company encourages all shareholders to participate in the Annual General Meetings (AGM) and to vote on all resolutions adopted by the Assembly, including the selection of the members of the Board. Any class of shareholders is entitled to attend the meetings of the General Assembly without paying any fees for their attendance. The voting in the General Assembly shall be by secret ballot.
The Board invites all shareholders to the AGM under the laws and regulations. When organizing the general meetings of the shareholders, the company includes the agenda and the date and place of the meeting in the invitation. In addition, the company provides all information related to the agenda items well before the General Assembly, particularly the reports of the Board, the external auditor and the financial statements.
The company encourages shareholders to actively participate in the General Assembly, discuss the issues on the agenda and related inquiries, and ask questions to Board members and the external auditor. The Board or the external auditor shall answer the questions to the extent that they do not jeopardize the interests of the company.
Shareholders are provided access to all the data contained in the disclosure register of the Board members and Executive Management members without any fees. In addition, shareholders are also entitled to access the minutes of the AGMs.
The company sends out invitations for the extraordinary general assembly meeting at the request of a number of shareholders who own at least fifteen per cent (15%) of the company’s capital within thirty (30) days from the date of the request as stated in the relevant laws. In addition, shareholders who own a percentage of five per cent (5%) of the company’s capital may add items to the agenda of the General Assembly meetings.
Each shareholder may file a case to nullify any decision issued by the Board or the general assembly (ordinary or extraordinary) in violation of the law, the company’s articles of association (AOA) or the company’s memorandum, or that was intended to harm the interests of the company. In addition, shareholders who own at least 15% of the capital may appeal before the court in the decisions of the ordinary and extraordinary General Assembly, which prejudice the rights of the minority shareholders.
Recognize the Roles of Stakeholders
Protecting the rights of stakeholders
The demands of our stakeholders are constantly evolving and engaging with them regularly is essential to the continuity of our business. Zain is committed to protecting the rights of stakeholders and creating benefits and job opportunities by ensuring a stable and strong financial position for the company. Accordingly, the Board is responsible for setting standards for protecting the rights of all stakeholders and updating them, as appropriate, to clarify changes in the provisions of the law, regulations, and instructions issued by the regulatory bodies.
The purpose of this policy is to focus on the company’s efforts to protect the rights of all stakeholders. This policy applies to the company, its subsidiaries, the Board, executive management, and employees, as each has a role in protecting the stakeholders’ rights. Therefore, all members of the company’s management and its employees must be aware of the requirements of this policy and the relevant laws and are working to comply with them.
Stakeholder categories include shareholders, regulators, customers, employees, the community, suppliers, and third- parties such as partners and competitors.
The company safeguards the protection of the rights of stakeholders through the following:
- Dealing with all stakeholders fairly and ensuring that members of the Board, related parties and stakeholders are treated fairly and without discrimination
- Allow stakeholders to access information and data related to their activities to obtain and refer to that information quickly and regularly
As the company guarantees the protection of the rights of stakeholders, it also expects all stakeholders to fulfil their obligations governed by contracts, laws and regulations issued by the relevant authorities.
Stakeholder participation and following the company’s operations
The major responsibilities of the company’s Board towards its stakeholders include:
- To appoint competent executive management – As executive management, headed by the CEO, is responsible for the day-to-day management of the company’s operations and for the implementation of the company’s strategy, it is one of the foremost responsibilities of the Board to select a company of personnel that is capable of performing this task competently.
- To effectively and efficiently supervise the company’s affairs – The company’s Board has overall responsibility for the company, including approving and overseeing the implementation of strategic objectives, risk strategy and corporate governance standards. This is in addition to the Board’s responsibility for overseeing executive management. The Board administers its supervisory duties directly or through its committees (Board Risk Committee, Board Audit Committee, and Board Nomination & Remuneration Committee).
- To adopt sound policies – The Board must provide executive management with a clear framework for managing the company’s operations. This is achieved by having oversight over the key policies followed within the company, covering such areas as investments, credit and asset and liability management, and other related policies.
- To remain abreast of the company’s conditions and performance – The Board is aware of any developments in the company’s internal or external environment. This enables the Board to intervene promptly when the need arises.
- To maintain proper capitalization of the company – Capital adequacy is one of the primary measures of a company’s financial health. Therefore, it is the responsibility of the Board to ensure that the company remains reasonably capitalized, taking into account regulatory requirements and the company’s strategic objectives.
- To observe laws, by-laws, and instructions – The company is governed by a set of regulations with which it must comply. It is ultimately the responsibility of the Board to ensure that there are no violations.
Our Stakeholders:
Our Customers
Communication Channels
- Interactive digital channel
- Customer satisfaction surveys
- Store experience surveys
- Services available through app, website, retail stores, contact centers
- Digital and alternative channels – inbound customer service agents & telesales
- Direct messaging, social media platforms and various media outlets
Priorities
- Reliable, accessible, innovative and affordable service
- Awareness about promotional material and other useful info
- Customized services
- Transparency and accuracy of billing
- Data protection and information security
- Efficient complaint resolutions
- Feedback analysis
Our People
Communication Channels
- Workshops
- Groupwide emails and awareness material
- In-person events
- Annual employee engagement surveys
- Whistleblowing form
- Zainers app
Priorities
- Job security and satisfaction
- Employee benefits
- Opportunities for development and growth
- Competitive salaries
- Have a relation to company’s core values and principles
- Access to international networking opportunities
- Health and safety protection
- Mental health and wellbeing
Our Suppliers
Communication Channels
- Open direct channels and automated process engagement
- Provide periodic assessments
- Supplier Code of Conduct
- Check against conflict of interests, related party transactions, and sanctions policies
- Efficient onboarding procedures
Priorities
- Embedding principles of diversity and inclusion
- Incorporating sustainability standards
- Provide timely payments
Our Community
Communication Channels
- Social media awareness campaigns
- Support and develop sustainable initiatives and activities
- Establish meaningful partnerships
- Participate in community events, forums and workshops
Priorities
- Build climate change mitigation and adaptation plans, in addition to biodiversity protection
- Enable an inclusive digital society
- Responsible supply chain management
- Commitment to upholding health and safety standards.
- Establish community outreach programs that support underprivileged communities
Our Investors
Communication Channels
- Meetings, conferences (in-person and virtual)
- Annual/interim reports and presentations
- Press Releases
- Disclosure of company material info
- Analyst Calls/Webcasts
- IR app/website/emails
- Social Media
- Annual General Meetings (AGM)
- Feedback and surveys
Priorities
- Financial reporting and integrity
- Communicating the Strategy
- News about operations and activities
- Industry-specific news and updates
- Dividend Policy
- ESG and corporate governance updates
- Regulatory Updates
- Investor Relations Events & Roadshows
Our Governments
Communication Channels
- CMA online portal
- Bourse Kuwait (disclosure portal, emails)
- KCC (Kuwait Clearing Company) emails communications, eAGM
- Inspection visits
- Disclosure forms
- Annual/periodic reports
- Participation in events, workshops, forums
- Meetings (in-person and virtual)
- Website (disclosure archive, reports, articles of associations, policies)
- Topic specific correspondence with regulatory authorities
- ACM
Priorities
- Compliance with laws and regulations
- Promoting best standards in the industry and the market
- ESG principles
- Disclosure and transparency
- Raising awareness about key topics such as ESG, digital transformation and innovation investment
Encourage and Enhance Performance
Board Training and Development Plan
Board evaluation is a legal requirement per corporate governance regulations in Kuwait, and it is one of the most important practices related to the Board’s performance. The Board of Zain clearly expresses the company’s vision, mission, and values; therefore, its performance is characterized by a clear purpose, effective leadership, and strategic direction.
The training program is designed to improve the effectiveness of the Board by expanding its awareness in all matters related to the company, its performance, the telecommunications sector, the markets in which it operates, and other important areas. The Board is always keen to utilize the available methods and techniques to improve its effectiveness.
The training program for the Board aims to create a real difference in the company’s performance. The Board develops its performance by exploring challenges related to the performance of its role. The Chairman of the Board reviews the members’ training and development needs based on the evaluation results and in cooperation with the BNRC. The Board seeks to develop its skills and competencies through training courses and increasing its knowledge of the leading technical aspects of the company’s activity.
The company has prepared an induction program for the members of the Board that contains information about the company, its performance, mission and vision, and all internal policies and procedures, in addition to meeting with the executive management, conducting field visits to the company’s facilities, attending presentations on strategic plans and the most important matters related to financial and accounting affairs, risk management, and compliance programs, the company’s internal and external auditors and legal advisors.
The company encourages members of the Board to attend training courses and seminars to develop members’ skills related to the company’s business.
Board Evaluation
Board performance evaluation clarifies individual and group roles to be more effective, translating into better corporate governance. The Board, its committees and individual members are evaluated annually. The evaluation of the Board includes several topics that affect its performance, added value, and the objectives of the company in general. Among these measures are the following:
- Attendance and key performance indicators following the company’s strategy and objectives and relevant laws and regulations
- The Board’s commitment to laws and regulations that deal with various topics such as business development, formation of the board’s structure, adoption of internal policies and other responsibilities and roles as determined by the regulations of the CMA
- Diversity, equity and inclusion in the composition of the Council
- Environmental, Social and Governance (ESG) Performance Standards
- Coordinating meetings, topics, and agendas by relevant laws
- The items of discussion, their objective and relevance and their impact on the company’s performance
- Telecom industry trends and latest developments
- The company’s risks and the most critical developments and procedures.
- Communication with stakeholders and the effectiveness of these channels
- Related party transactions and conflicts of interest
- Discussing the reports issued by the regulatory authorities, auditors, or any inspection team and the work plans
- Deviations from the approved budget
- Required training courses
- Acquiring required information in a timely manner
Many benefits can be considered for evaluating the Board and developing its performance. These benefits include creating an opportunity for members to self-reflect, analyze and assess areas of weakness, providing Board members with a tool to measure their effectiveness and competencies, stimulating a learning culture, and defining action plans to improve communication for effective decision-making. In addition, this process will improve the working relationship between the committees and the Board. It will facilitate identifying the training needs of the Board to ensure keeping abreast of the latest developments.
The Board’s annual self-evaluation is one of the most effective ways to create a space for communicating any concerns and measuring the board of directors’ performance. During the self-evaluation process, the members are given the chance to expand their knowledge and awareness, be reminded of their responsibilities, and create a healthy Board culture. Self-evaluation is considered one of the most effective ways to give room for the members of the Board to express their opinions and add value to the performance of the Board, which is shaped by their personal touch and stems from the experience and background of each member.
The Board decided to conduct a self-assessment of their performance during 2022, covering all areas and criteria based on the assessments made during the past three years by an external party. In addition, the Board has incorporated updates to reflect recent trends and requirements by regulators and the best global standards. The Board evaluates itself and is assisted and supported by the Secretary of the Board and the BNRC. The evaluation is provided to all members by the Secretary in an online questionnaire, and the results are analyzed. Decisions regarding performance development are made based on the feedback.
Value Creation
Zain’s Board is responsible for overseeing the company’s business and the performance of executive management. The Board also oversees the overall conduct of achieving our strategic objectives and creating long-term success to generate sustainable value for our shareholders and other stakeholders. The Board seeks to lay the foundation for a bright and sustainable future, aiming to accelerate growth through responsible, inclusive and sustainable technology. The goal is to ensure that Zain continues to build trust and create value for stakeholders. In addition, the Board monitors progress on the digital impact and sustainability policy and oversees progress in achieving goals related to climate and the environment.
Zain has adopted sustainability practices in response to emerging challenges and stakeholder expectations through environmental, social and governance (ESG standards. Strategic focus in these ESG areas leads to superior financial performance and motivates the Board and Executive Management to keep abreast of developments in the industry and achieve the highest value for shareholders and stakeholders. In addition, trust and integrity in business operations lead to the attraction and retention of shareholders and increased customer loyalty. These non-financial factors act as sources of competitive advantage, which increases the company’s value in the long run.
Similar positive effects resulting from an excellent performance in the areas of ESG come through more operational capabilities, quality of management, increase in confidence and efficiency of execution, and more efficient management of capital. These factors also indicate the company’s ability to make sound decisions strategically. As a result, it leads to allocating and attracting wealth and leading the company in an effective, productive and valuable way. In addition, ESG disclosures impact the company’s reputation, leading to an increase in the company’s market value, thus, achieving higher value for shareholders in the long-term.
Focus on the importance of social responsibility
A summary of the development of a policy that ensures a balance between each of the company’s goals and society’s goals.
The Corporate Sustainability (CS) department at Zain is responsible for assessing the company’s social, economic and environmental impacts to create long-lasting value for the organization and its stakeholders. The CS department works cross-functionally to embed the CS strategy across the company’s entire value chain. Zain’s CS strategy aims to provide meaningful connectivity that leads to equitable and inclusive systemic change across Zain’s communities.
The company developed its CS policy to support and outline the role of the CS department and ensure that the CS strategy is embedded across the company’s business activities. The CS strategy is in direct alignment with the company’s 4sight strategy contributing towards achieving the company’s goals and strategic targets. The CS policy is an official statement that confirms Zain’s commitment to addressing key social, economic and environmental challenges in its markets. The key focus areas highlighted in the policy are an extension of Zain’s overall CS strategy, which include but are not limited to climate change, supply chain management, data privacy and security, child online safety and youth unemployment.
The CS policy is available on the company’s official website to ensure all stakeholders can access the policy in Arabic and English.
An overview of the programs and initiatives in the field of social work
Under Zain’s newly established Corporate Sustainability strategy 2020-2025, the company continues to establish programs that help support the achievement of the strategic targets.
1 Climate Change:
In 2022, Zain continued to embrace its evolving landscape by revisiting the assumptions regarding climate- related issues and how they might impact the business in the short-, medium- and long term. To remain agile and competitive and address its stakeholders’ concerns, the company continued to transition from a business- as-usual energy-intense organization to a Net-Zero emissions’ pathway.
To do so and embark on a comprehensive transition, Zain developed its Climate Change Compliance Framework. As a result, it is necessary to structure climate change adaptation and mitigation initiatives, allowing the company to assess its business resilience to physical and transition risks and create more value for its shareholders and customers.
From a community and customer standpoint, the company continued to track and measure behavioral change concerning climate-related issues. As a result, Zain set quantitative targets for each of its markets to address 40% of its customer base by 2025. After revising the targets in 2022, the company increased the target by 10%. Additionally, Zain continues to further efforts in afforestation initiatives through partnerships with multiple stakeholders, including governmental entities and environmental organizations.
Each market conducted a variety of communication campaigns where Zain embedded pre- and post-surveys to assess and measure generated impacts. The following are examples of the awareness campaigns launched in each market:
Bahrain
- Under its annual e-waste campaign, the company conducted an e-waste competition where students across 23 public and private schools participated in a country-wide competition resulting in the top three schools being awarded prizes from Zain.
- To conserve the Bahraini agricultural heritage and enhance biodiversity, Zain Bahrain collaborated with the National Initiative of Agriculture Development (NIAD); Zain Bahrain supported an afforestation program of the Al Istiqlal Walkway in the Kingdom planting a total of 230 trees with a target of planting 1,000 by 2023.
Iraq
- In 2022, Zain Iraq reached 10 million people via its awareness campaigns on topics tackling plastic consumption, water pollution, and afforestation to measure behavioral change.
- Zain Iraq collaborated with Nakhleh Company to support the Ekfel Palm project, which aims to plant palms and spread awareness on carbon offsetting initiatives planting 2,000 palm trees to date.
Jordan
- Zain Jordan, in partnership with its innovation center ZINC, launched its very first climate change hackathon targeting innovative ideas and projects to solve emerging environmental challenges in the following areas: Water crisis, energy consumption, agriculture, and waste management. 200 participants and 52 ideas were pitched, and two winners were selected to receive funding and support from Zain.
Kuwait
- Zain Kuwait partnered with the Kuwait Dive Team to collect waste in Kuwait Territorial Waters. Through this collaboration, Zain Kuwait aims to raise much-needed awareness on marine pollution, collecting a total of 2,850 tons of waste.
Saudi Arabia
- Zain Saudi Arabia supported the National Green Initiative by planting 12,000 trees under the Um Al Shagoog reforestation initiative in partnership with Green Horizon. The initiative aims to increase vegetation in the Um Al Shagoog park, which covers 18 million square meters, to enhance biodiversity and promote ecological regeneration.
Sudan
- Zain collaborated with the Sudan Animal Rescue Center in Khartoum to rehome and rehabilitate endangered species found in the country, most prominently the center’s lions. In addition, Zain provided irrigation supplies, planted 500 seedlings across the center, and provided a caravan that could be used as a mobile veterinary clinic.
South Sudan
- Zain launched a country-wide SMS campaign to its 1.4 million subscribers on World Environment Day and corresponding social media campaigns.
2 Operating Responsibly
To address ESG impacts, Zain’s approach to responsible supply chain management encompasses all the companies’ operations. The company has been working with its suppliers to upskill them and further develop their awareness and knowledge on sustainability-related components. As part of the supplier assessment and selection criteria, sustainability-related aspects of the supply chain ranging from sourcing materials, health and safety, human and labor rights, to anti-corruption, are embedded in the process.
This year, Zain further developed its physical audit process by creating an additional level of verification by establishing an observation form. This form ensures Zain reports on risks identified because of physical audits. The observation form ranks the severity of the observation raised and if considered high-risk and a violation of the supplier code of conduct, the supplier undergoes a termination process. Throughout the year, zero suppliers were terminated based on results of the physical audit.
Data Privacy
To address the growing concerns over data privacy, Zain aims to empower marginalized communities through targeted training programs equipping individuals from these communities with essential knowledge and skills related to data privacy. By fostering awareness and understanding, Zain seeks to bridge the digital literacy gap and empower marginalized groups to navigate the evolving landscape of data protection effectively.
Throughout the year, each of Zain’s operations finalized its plan on the data privacy programs and identified the target segment. Some of the operations progressed their efforts while others will be conducting them in 2024.
3 Inclusion
People with Disabilities:
- To foster inclusivity, Zain employees, including sales agents, human resources, corporate communications, technology, and others, are learning sign language to better interact with customers, colleagues, and potential hires with hearing impairments. In 2023, 88 more employees were trained, bringing the total to over 385 across Zain’s operations in their respective national sign languages.
- Zain Bahrain advanced its ‘Natawasel’ service, the first sign language video call center in government health centers. Developed to prevent medical misdiagnoses for the deaf and hard-of-hearing, Natawasel collaborated with the Bahraini Deaf Society. Video call services are available in 27 health centers, with over 891 calls logged. In 2024, Zain Bahrain aims to extend this service to the country’s traffic and emergency lines.
Women in Tech:
Women in Tech was established in 2021, based on research conducted on women in STEM-related fields in the MENA region. Zain continued to scale its Women in Tech program across its operating markets where it matches female STEM students with experts from Zain’s operations to be mentored. Through these successful matches, the program aims to enable future generations of females to enter the field with the promise of becoming change-makers in the industry.
In 2023, the third cycle of Women in Tech was launched in Iraq, Jordan, and Saudi Arabia. Every year, the program evolves to better address the needs of the target community through focus groups, surveys, and feedback sessions. A total of 408 young women joined the program across the Group, showcasing a 6% increase from 2022.
4 Generation Youth:
Zain Group scored 8.4/10 in the Children’s Right and Business 2023 Global Benchmark, ranking as fifth in the Telecom sector and 21st company across all sectors. It reached Leader position against a sector average of 5.8/10 and a regional average of 3.4/10.
Child Online Safety:
- Zain continued to take major strides in installing mechanisms that prevent child sexual abuse material (CSAM) through Project Arachnid and the Internet Watch Foundation (IWF) across its operations. As part of the ongoing commitment to online safety, Zain remains vigilant in adopting technologies that enhance the detection and prevention of CSAM, thus contributing to a safer and more secure digital space for all.
- The company is a part of the revitalized GSMA Mobile Alliance against Digital Child Sexual Exploitation. The Mobile Alliance is centered on taking proactive steps to fight technology-facilitated child sexual exploitation. It adopts a multi-stakeholder approach and engages with key international stakeholders to ensure a well-coordinated response. The efforts include setting and promoting standards, offering online safety education, supporting national helplines, collaborating with law enforcement, using influence to encourage multi-stakeholder action, and staying informed through consultation with partners within the Alliance.
Digital Literacy
- For the fourth consecutive year, Zain Bahrain partnered with the Supreme Council for Women to offer the Girls for Tech program, powered by Clever Play, an organization that embeds STEM learning in children’s education. The program provides girls aged 8-14 with skills on coding, website creation, and basic robotics.
Youth Unemployment
- The Ra’idat Program, a local competition initiated by the French Embassy in Iraq and executed in collaboration with Zain Iraq and the Station, the first co-working space for entrepreneurs in Baghdad, aims to support and empower female Iraqis in their entrepreneurial pursuits. This initiative provides a platform for women across different cities in the country, fostering their business development and implementation. In 2023, the program achieved significant participation, with over 150 females engaging in the competition, underscoring its impactful role in promoting and nurturing entrepreneurship among Iraqi women.
- Launched in 2008, Zain Jordan continued to provide training for youth with mobile maintenance skills to increase employment opportunities under its Mobile Maintenance Center. This year, the company trained youth in mobile maintenance, fixing fiber technology, and gaming devices. Across six governorates where the centers are located, 203 graduated the program and 162 were employed in 2023.
INDEPENDENT AUDITOR’S REPORT
TO THE SHAREHOLDERS OF MOBILE
TELECOMMUNICATIONS COMPANY K.S.C.P.
REPORT ON THE AUDIT OF THE CONSOLIDATED
FINANCIAL STATEMENTS
-
QUALIFIED OPINION
We have audited the consolidated financial statements of Mobile Telecommunications Company K.S.C.P. (the “Company”) and its subsidiaries (the “Group”), which comprise the consolidated statement of financial position as at 31 December 2023, and the consolidated statement of profit or loss, consolidated statement of profit or loss and other comprehensive income, consolidated statement of changes in equity and consolidated statement of cash flows for the year then ended, and notes to the consolidated financial statements, including material accounting policy information.
In our opinion, except for the effects of the matter described in the Basis for Qualified Opinion section of our report, the accompanying consolidated financial statements present fairly, in all material respects, the consolidated financial position of the Group as at 31 December 2023, and its consolidated financial performance and its consolidated cash flows for the year then ended in accordance with International Financial Reporting Standards (IFRS Accounting Standards) (IFRSs).
-
BASIS FOR QUALIFIED OPINION
As disclosed in note 2.1 to the consolidated financial statements, the Group has excluded the effects reported therein of applying International Accounting Standard (IAS) 29: Financial Reporting in Hyperinflationary Economies with respect to its subsidiaries in the Republic of Sudan. It is not possible to determine with reasonable certainty the exact impact of applying hyperinflationary accounting for these subsidiaries as the Group has not performed the required calculations. In these circumstances, we are unable to quantify the effect of the departure from IAS 29.
We conducted our audit in accordance with International Standards on Auditing (ISAs). Our responsibilities under those standards are further described in the Auditor’s Responsibilities for the Audit of the Consolidated Financial Statements section of our report. We are independent of the Group in accordance with the International Code of Ethics for Professional Accountants (including International Independence Standards) (IESBA Code), and we have fulfilled our other ethical responsibilities in accordance with the IESBA Code. We believe that the audit evidence we have obtained is sufficient and appropriate to provide a basis for our qualified opinion.
-
EMPHASIS OF MATTER
We draw attention to note 2 of the consolidated financial statements, which describe that the Group’s operations in Sudan have been affected as a result of the military operations taking place in Sudan since 15 April 2023. Our opinion is not modified in respect of this matter.
-
KEY AUDIT MATTERS
Key audit matters are those matters that, in our professional judgment, were of most significance in our audit of the consolidated financial statements of the current year. These matters were addressed in the context of our audit of the consolidated financial statements as a whole, and in forming our opinion thereon, and we do not provide a separate opinion on these matters.
-
KEY AUDIT MATTER
Revenue recognition
The Group recognized revenue from telecom services amounting to KD 1.9 billion for the year ended 31 December 2023.There is inherent complexity in the telecom services revenue recognition process because of the complexity of the related Information Technology (“IT”) environment, the processing of large volumes of data through a number of different IT systems and the combination of different products.
The process from setting up of customers in network system through generation of call records till recognition of revenue in the accounting records is highly automated and does not involve significant judgements. However, there is a risk management override related to revenue occurrence as there could be inappropriate manual journal entries, given revenue is a key performance indicator for stakeholders.
Even though the inherent risk of complexities in the revenue recognition process is reduced through the highly automated nature of the systems, due to the inherent risk of fraud associated with revenue recognition, particularly occurrence of revenue as described above, we have considered this as a key audit matter.
The accounting policy for revenue recognition is set out in note 2.3.16 and the related disclosures are made in note 19 and note 26 to the consolidated financial statements.
-
HOW OUR AUDIT ADDRESSED THE KEY AUDIT MATTER
Our audit procedures included:
- An understanding of the significant revenue processes and identifying the relevant controls, IT systems, interfaces and reports;
- An evaluation of the relevant IT systems, with the assistance of our internal IT specialists, and testing the design and implementation of relevant internal controls related to revenue recognition.
- Testing the operating effectiveness of relevant controls over the recording of revenue transactions and the change control procedures in place around the systems.
- Verifying key reconciliations performed by the Group’s Revenue Assurance team, including testing end to end reconciliation from business support systems to billing and rating systems to the general ledger.
- Identifing revenue related manual journal entries posted to the general ledger and agreeing these entries to the underlying supporting documentation on a sample basis.
- Testing a sample of subscribers to determine that the revenue is recognised based on a valid customer contract.
- Verifying the reconciliation of deferred revenue to the charging system and the recognition of this revenue in profit or loss.
We also assessed the disclosures in the consolidated financial statements relating to this matter against the requirements of IFRSs.
-
IMPAIRMENT OF GOODWILL
As at 31 December 2023, goodwill is carried at KD 534 million which represents 10.7% of the total assets.
The impairment test of goodwill performed by management is significant to our audit because the assessment of the recoverable amount of goodwill under the value-in-use basis is complex and requires considerable judgment on the part of management. Estimates of future cash flows are based on management’s views of variables such as the growth in the telecommunications sector, economic growth, expected inflation rates and yield.
Therefore, we identified the impairment testing of goodwill as a key audit matter.
The Group’s policy on assessing impairment of goodwill is set out in note 2.3.8 and related disclosures are made in note 12 to the consolidated financial statements.
We evaluated the controls over the impairment assessment process to determine if they had been appropriately designed and implemented.
With the support of our internal valuation experts, we benchmarked and challenged key assumptions forming the Group’s value-in-use calculation including the cash flow projections and discount rate.
We compared actual historical cash flows with previous forecasts and assessed differences, if any, were within an acceptable range. We assessed the cash flow forecasts and compared the discount rate and growth rate to market data.
We analyzed the sensitivities such as the impact on the valuation if the growth rate would be decreased, or the discount rate would be increased.
We also assessed the disclosures in the consolidated financial statements relating to this matter against the requirements of IFRSs.
-
-
OTHER INFORMATION
Management is responsible for the other information. The other information comprises of the information included in the Annual Report of the Group for the year ended 31 December 2023. The other information does not include the consolidated financial statements and our auditor’s report thereon. We obtained the report of the Company’s Board of Directors prior to the date of our auditor’s report and we expect to obtain the remaining sections of the Group’s Annual Report for the year ended 31 December 2023 after the date of our auditor’s report.
Our opinion on the consolidated financial statements does not cover the other information and we do not and will not express any form of assurance conclusion thereon.
In connection with our audit of the consolidated financial statements, our responsibility is to read the other information identified above when it becomes available and, in doing so, consider whether the other information is materially inconsistent with the consolidated financial statements or our knowledge obtained in the audit, or otherwise appears to be materially misstated.
If, based on the work we have performed on the other information that we obtained prior to the date of this auditor’s report, we conclude that there is a material misstatement of this other information, we are required to report that fact. We are unable to conclude if the other information is materially misstated as a result of the matters described in the Basis for Qualified Opinion section of our report.
-
RESPONSIBILITIES OF MANAGEMENT AND THOSE CHARGED WITH GOVERNANCE FOR THE CONSOLIDATED FINANCIAL STATEMENTS
Management is responsible for the preparation and fair presentation of the consolidated financial statements in accordance with IFRSs, and for such internal control as management determines is necessary to enable the preparation of consolidated financial statements that are free from material misstatement, whether due to fraud or error.
In preparing the consolidated financial statements, management is responsible for assessing the Group’s ability to continue as a going concern, disclosing, as applicable, matters related to going concern and using the going concern basis of accounting unless management either intends to liquidate the Group or to cease operations, or has no realistic alternative but to do so.
Those charged with governance are responsible for overseeing the Group’s financial reporting process.
-
AUDITOR’S RESPONSIBILITIES FOR THE AUDIT OF THE CONSOLIDATED FINANCIAL STATEMENTS
Our objectives are to obtain reasonable assurance about whether the consolidated financial statements as a whole are free from material misstatement, whether due to fraud or error, and to issue an auditor’s report that includes our opinion. Reasonable assurance is a high level of assurance, but is not a guarantee that an audit conducted in accordance with ISAs will always detect a material misstatement when it exists. Misstatements can arise from fraud or error and are considered material if, individually or in the aggregate, they could reasonably be expected to influence the economic decisions of users taken on the basis of these consolidated financial statements.
As part of an audit in accordance with ISAs, we exercise professional judgment and maintain professional skepticism throughout the audit. We also:
- Identify and assess the risks of material misstatement of the consolidated financial statements, whether due to fraud or error, design and perform audit procedures responsive to those risks, and obtain audit evidence that is sufficient and appropriate to provide a basis for our opinion. The risk of not detecting a material misstatement resulting from fraud is higher than for one resulting from error, as fraud may involve collusion, forgery, intentional omissions, misrepresentations, or the override of internal control.
- Obtain an understanding of internal control relevant to the audit in order to design audit procedures that are appropriate in the circumstances, but not for the purpose of expressing an opinion on the effectiveness of the Group’s internal control.
- Evaluate the appropriateness of accounting policies used and the reasonableness of accounting estimates and related disclosures made by the management.
- Conclude on the appropriateness of management’s use of the going concern basis of accounting and based on the audit evidence obtained, whether a material uncertainty exists related to events or conditions that may cast significant doubt on the Group’s ability to continue as a going concern. If we conclude that a material uncertainty exists, we are required to draw attention in our auditor’s report to the related disclosures in the consolidated financial statements or, if such disclosures are inadequate, to modify our opinion. Our conclusions are based on the audit evidence obtained up to the date of our auditor’s report. However, future events or conditions may cause the Group to cease to continue as a going concern.
- Evaluate the overall presentation, structure and content of the consolidated financial statements, including the disclosures, and whether the consolidated financial statements represent the underlying transactions and events in a manner that achieves fair presentation.
- Obtain sufficient appropriate audit evidence regarding the financial information of the entities or business activities within the Group to express an opinion on the consolidated financial statements. We are responsible for the direction, supervision and performance of the group audit. We remain solely responsible for our audit opinion.
We communicate with those charged with governance regarding, among other matters, the planned scope and timing of the audit and significant audit findings, including any significant deficiencies in internal control that we identify during our audit.
We also provide those charged with governance with a statement that we have complied with relevant ethical requirements regarding independence, and to communicate with them all relationships and other matters that may reasonably be thought to bear on our independence, and where applicable, actions taken to eliminate threats or safeguards applied.
From the matters communicated with those charged with governance, we determine those matters that were of most significance in the audit of the consolidated financial statements of the current year and are therefore the key audit matters. We describe these matters in our auditor’s report unless law or regulation precludes public disclosure about the matter or when, in extremely rare circumstances, we determine that a matter should not be communicated in our report because the adverse consequences of doing so would reasonably be expected to outweigh the public interest benefits of such communication.
-
REPORT ON OTHER LEGAL AND REGULATORY REQUIREMENTS
Furthermore, in our opinion proper books of accounts have been kept by the Company and the consolidated financial statements, together with the contents of the report of the Company’s Board of Directors relating to these consolidated financial statements, are in accordance therewith. We further report that we obtained all the information and explanations that we required for the purpose of our audit and that the consolidated financial statements incorporate all the information that is required by the Companies Law No. 1 of 2016 and its Executive Regulations and by the Company’s Memorandum of Incorporation and Articles of Association, as amended, that an inventory was duly carried out and that, to the best of our knowledge and belief, no violations of the Companies Law No. 1 of 2016 and its Executive Regulations or of the Company’s Memorandum of Incorporation and Articles of Association, as amended, have occurred during the year ended 31 December 2023 that might have had a material effect on the business of the Company or on its financial position.
We further report that, during the course of our audit, we have not become aware of any material violations of the provisions of Law No. 7 of 2010, concerning the Capital Markets Authority and its related regulations, as amended, during the year ended 31 December 2023, that might have had a material effect on the business of the Company or on its financial position.

Bader A. Al-Wazzan
Licence No. 62A
Deloitte & Touche – Al-Wazzan & Co.Kuwait
06 March 2024
Consolidated Statement of Financial Position
(As at 31 December 2023)
The accompanying notes are an integral part of these consolidated financial statements.

Osamah Othman Alfuraih
Chairman

Bader Nasser Al Kharafi
Vice Chairman & Chief Executive Officer
Consolidated Statement of Profit or loss
(Year ended 31 December 2023)
The accompanying notes are an integral part of these consolidated financial statements.
Consolidated Statement of Profit or Loss and Other Comprehensive Income
(Year ended 31 December 2023)
The accompanying notes are an integral part of these consolidated financial statements.
Consolidated statement of changes in equity
(Year Ended 31 December 2023)
Equity attributable to Company’ shareholders
The accompanying notes are an integral part of these consolidated financial statements.
Consolidated Statement of Cash Flow
(Year ended 31 december 2023)
The accompanying notes are an integral part of these consolidated financial statements.
Notes to Consolidated Financial Statements – 31 December 2023
1. Incorporation and activities
+
Mobile Telecommunications Company K.S.C.P. (the “Company”) is a Kuwaiti shareholding company incorporated in 1983. Its shares are traded on the Kuwait Stock Exchange. The registered office of the Company is at P.O. Box 22244, 13083 Safat, State of Kuwait.
The Company and its subsidiaries (the “Group”) along with associates provide mobile telecommunication services in Kuwait and 7 other countries (31 December 2022 – Kuwait and 7 other countries) under licenses from the governments of the countries in which they operate; purchase, deliver, install, manage and maintain mobile telephone systems; and invests surplus funds in investment securities.
The Company is a subsidiary of Oman Telecommunications Company SAOG, Oman (“Parent Company”).
These consolidated financial statements were authorized and approved for issue by the Board of Directors of the Company on 06 March 2024 and are subject to approval of the shareholders at their forthcoming Annual General Meeting.
2. Basis of preparation and material accounting policy information
+
2.1 Basis of preparation
+
These consolidated financial statements have been prepared in conformity with International Financial Reporting Standards (IFRS Accounting Standards) issued by the International Accounting Standards Board (IASB) and interpretations issued by the International Financial Reporting Interpretations Committee (IFRIC). These consolidated financial statements are prepared under the historical cost basis of measurement adjusted for the effects of inflation where entities operate in hyperinflationary economies and modified by the revaluation at fair value of financial assets held as “at fair value through profit or loss”, “at fair value through other comprehensive income” and “derivative financial instruments”. These consolidated financial statements have been presented in Kuwaiti Dinars (KD), rounded to the nearest thousand.
The economy of Republic of South Sudan became hyperinflationary in 2016. Accordingly, the results, cash flows and financial position of the Group’s subsidiary in South Sudan have been expressed in terms of the measuring unit current at the reporting date in accordance with IAS 29: Financial Reporting in Hyperinflationary Economies. The methods used to measure the fair value and adjustments made to the accounts of Group’s entities that operate in the hyperinflationary economies are discussed further in the accounting policies and in the respective notes.
In 2015, the Group noted that the economy of the Republic of Sudan, where the Group has subsidiaries, may be hyperinflationary from the beginning of 2015. This was based on the general price index showing the cumulative three-year rate of inflation exceeding 100% at that time. However, International Accounting Standard, IAS 29: Financial Reporting in Hyperinflationary Economies, does not establish an absolute rate at which hyperinflation is deemed to arise and states that it is a matter of judgment when restatement of financial statements in accordance with this Standard becomes necessary. In addition, the Group noted that in the 2014 International Monetary Fund (IMF) Sudan country report, the cumulative projected three year inflation rate outlook for Sudan in 2016 to be around 57% and thus, applying IAS 29 in 2015, could have entailed going in and out of hyperinflation within a short period which was confirmed when the Republic of Sudan went out of hyperinflation in 2016. The Republic of Sudan has been again declared as hyperinflationary in 2018. Based on the above matters, Group believes that there is no definitive basis to apply IAS 29 at this stage. However, Group will review it on an ongoing basis, accordingly it has not quantified the impact of applying IAS 29 as of 2023.
The preparation of consolidated financial statements in conformity with IFRS requires management to make estimates and assumptions that may affect the reported amounts of assets and liabilities and disclosure of contingent assets and contingent liabilities at the date of the consolidated financial statements and the reported amounts of revenues and expenses during the reporting period. It also requires management to exercise its judgment in the process of applying the accounting policies. The areas involving a high degree of judgment or complexity or areas where assumptions and estimates are significant to these consolidated financial statements are disclosed in note 35.
Political uncertainty in Sudan
On 15 April 2023, a violent power struggle erupted in Khartoum, the capital of Sudan, involving the two primary factions of the ruling military regime. This conflict has directly affected the Group’s operations in Sudan and its telecommunication assets, as certain areas in Sudan continue to experience high levels of hostility or temporary control by opposing forces. These events have had an adverse impact on the country’s economy and consequently, on the Group’s business and operational outcomes in Sudan.
As of the issuance date of these consolidated financial statements, the Group has not incurred any significant damage to crucial assets that would hinder its ability to sustain operations.
Since 15 April 2023, continuous monitoring of network and base station equipment has been in place, particularly in areas experiencing significant downtime. Various actions, such as reallocation of network traffic, capacity expansion, and other measures aimed at restoring network coverage and ensuring satisfactory network performance, are being implemented. Zain Sudan is actively involved in performing essential network maintenance, repairs, and optimizations utilizing both its current equipment and external resources. Zain Sudan currently holds agreements with suppliers of network equipment, and transportation routes for its delivery are accessible in all regions of Sudan, except for North Darfur, North Kordofan, Wad-Madani and Khartoum, which are facing the most significant impact from the ongoing hostilities.
The Group has taken appropriate actions to ensure the continuity of communication services and operations. The management has prepared and reviewed the updated financial forecasts for the year, taking into consideration most likely and possible downside scenarios for the ongoing business impacts of the war. These forecasts were based on the following key assumptions:
- There will be no substantial increase in the intensity of hostilities, thereby not adversely impacting the number of active sites, significantly.
- Zain Sudan will have the capability to conduct maintenance and repair tasks in the affected territories of Sudan, ensuring a satisfactory level of network performance in regions where it is feasible while considering the physical security of technical specialists;
- There will be no significant fluctuations in the fuel rate, foreign exchange rates and other major costs during the course of the conflict;
- Zain Sudan will be able to ensure the uninterrupted functioning of its crucial IT infrastructure, aligning with management’s implemented measures and incident response and disaster recovery plans;
- The generated revenue from service and product sales will be sufficient for Zain Sudan to meet both operating expenses and essential capital investments.
Based on these forecasts, considering possible adverse scenarios, management reasonably expects that the Group possesses adequate resources to effectively handle its operations in Sudan. Management will maintain ongoing monitoring of the potential repercussions and will proactively implement all available measures to minimize any adverse consequences.
If a worst-case scenario unfolds with widespread hostilities across Sudan, it can be anticipated that the Group’s operations may encounter disruptions for an indeterminate duration. This represents an uncertainty that is beyond the control of the Group. After evaluating the revised forecasts, management has examined Zain Sudan’s capability to operate as a going concern at the time of releasing these consolidated financial statements. As a result, it has determined that there are no significant uncertainties that could impede the Zain Sudan’s infrastructure and operations, thereby casting significant doubt on its ability to continue as a going concern. Consequently, Zain Sudan is expected to be able to realize its assets and fulfill its obligations in the ordinary course of business. The management of Zain Sudan has concluded that it is appropriate to prepare the consolidated financial statements on a going concern basis.
Because of the ongoing conflict in Sudan as described above, there have been some damages to network equipment, spares and inventories. Unfortunately, the current situation is not viable for the management of the Zain Sudan to access these areas and take stock of the actual damages and losses due to continuing hostilities in these regions. Based on an initial assessment of the damages mainly in the main warehouse in Khartoum, Zain Sudan has recorded an impairment loss of SDG 25.51 billion (KD 13.476 million) on its property and equipment and a provision for damage to its inventories amounting to SDG 2.31 billion (KD 1.222 million) respectively during the current year.
Due to security concerns in certain locations, Zain Sudan is not able to exercise control over some of its property and equipment with a net book value of SDG 4.57 billion (KD 1.691 million) representing 703 network sites as of 31 December 2023. The management of Zain Sudan does not expect any significant damage to the Zain Sudan’s network sites in the Sudanese regions of North Darfur, North Kordofan, Wad-Madani and Khartoum and has concluded that the sites located in these affected areas have the ability to generate future economic benefits.
The Zain Sudan’s management estimate such losses are fully covered under the Political Violence Insurance Policy and has submitted an initial provisional claim of USD 47.980 million (KD 14.698 million) with the insurer mainly relating to the equipment, spares and commercial items in the main warehouse which was partially set on fire during the conflict. According to the Political Violence Insurance Policy, Zain Sudan also have a claim for Business Interruption loss over a twelve-month period. In the opinion of Zain Sudan’s management, losses, if any, will be fully recovered from the insurance company and based on the current assessment per available information, no significant financial impact is anticipated on the consolidated financial statements.
Sudan experienced a network blackout starting from 7 February 2024 as all the three main internet operators in Sudan were either partially or completely offline and discussions to resolve this issue are in progress. Subsequently, Zain Sudan has restored its services in Port Sudan and other neighboring states by setting up a new switch and data center in Port Sudan.
Going concern
The directors have, at the time of approving the financial statements, a reasonable expectation that the Group have adequate resources to continue in operational existence for the foreseeable future. Thus they continue to adopt the going concern basis of accounting in preparing the financial statements.
2.2 New and revised accounting standards
+
The accounting policies used in the preparation of these consolidated financial statements are consistent with those used in the previous year except for the following new and amended IASB Standards during the year.
2.2.1 New and amended IFRS Standards that are effective for the current year
+
The Group has applied the following new and revised IFRS Standards that have been issued and effective:
- IFRS 17, ‘Insurance contracts’ – This standard replaces IFRS 4, which permits a wide variety of practices in accounting for insurance contracts. IFRS 17 will fundamentally change the accounting by all entities that issue insurance contracts and investment contracts with discretionary participation features.
- Amendments to IAS 1 and IFRS Practice statement 2 – Disclosure of accounting policies – The amendments change the requirements in IAS 1 with regard to disclosure of accounting policies. The amendments replace all instances of the term ‘significant accounting policies’ with ‘material’ accounting policy information. Accounting policy information is material if, when considered together with other information included in an entity’s financial statements, it can reasonably be expected to influence decisions that the primary users of general purpose financial statements make on the basis of those financial statements.
- Amendments to IAS 8 – The amendments replace the definition of a change in accounting estimates with a definition of accounting estimates. Under the new definition, accounting estimates are “monetary amounts in financial statements that are subject to measurement uncertainty”.
- Amendment to IAS 12 – deferred tax related to assets and liabilities arising from a single transaction. The amendments introduce a further exception from the initial recognition exemption. Under the amendments, an entity does not apply the initial recognition exemption for transactions that give rise to equal taxable and deductible temporary differences. Depending on the applicable tax law, equal taxable and deductible temporary differences may arise on initial recognition of an asset and liability in a transaction that is not a business combination and affects neither accounting profit nor taxable profit.
- Amendment to IAS 12 – International tax reform – pillar two model rules – These amendments give companies temporary exception from accounting for deferred taxes arising from the Organisation for Economic Co-operation and Development’s (OECD) international tax reform. Following the amendments, an entity is required to disclose that it has applied the exception and to disclose separately its current tax expense (income) related to Pillar Two income taxes.
The application of this amendment did not have a significant impact on the Group’s consolidated financial statements.
2.2.2 Standards issued but not effective
+
At the date of authorization of these financial statements, the Group has not applied the following new and revised IFRS Standards that have been issued but are not yet effective:
The management does not expect the adoption of the Standards and Interpretations listed above to have a material impact on the consolidated financial statements of the Group in future periods.
2.3 Material accounting policy information
+
2.3.1 Business combinations
+
Acquisitions of businesses are accounted for using the acquisition method. The consideration transferred in a business combination is measured at fair value, which is calculated as the sum of the acquisition-date fair values of assets transferred by the Group, liabilities incurred by the Group to the former owners of the acquiree and the equity interest issued by the Group in exchange for control of the acquiree. Acquisition-related costs are recognised in profit or loss as incurred.
At the acquisition date, the identifiable assets acquired and the liabilities assumed are recognised at their fair value at the acquisition date, except that:
- Deferred tax assets or liabilities and assets or liabilities related to employee benefit arrangements are recognized and measured in accordance with IAS 12 and IAS 19 respectively;
- Liabilities or equity instruments related to share-based payment arrangements of the acquiree or share-based payment arrangements of the Group entered into to replace share-based payment arrangements of the acquiree are measured in accordance with IFRS 2 at the acquisition date (see below); and
- Assets (or disposal groups) that are classified as held for sale in accordance with IFRS 5 are measured in accordance with that Standard.
Goodwill is measured as the excess of the sum of the consideration transferred, the amount of any non-controlling interests in the acquiree, and the fair value of the acquirer’s previously held equity interest in the acquiree (if any) over the net of the acquisition-date amounts of the identifiable assets acquired and the liabilities assumed. If, after reassessment, the net of the acquisition-date amounts of the identifiable assets acquired and liabilities assumed exceeds the sum of the consideration transferred, the amount of any non-controlling interests in the acquiree and the fair value of the acquirer’s previously held interest in the acquiree (if any), the excess is recognised immediately in profit or loss as a bargain purchase gain.
When the consideration transferred by the Group in a business combination includes a contingent consideration arrangement, the contingent consideration is measured at its acquisition-date fair value and included as part of the consideration transferred in a business combination. Changes in fair value of the contingent consideration that qualify as measurement period adjustments are adjusted retrospectively, with corresponding adjustments against goodwill. Measurement period adjustments are adjustments that arise from additional information obtained during the ‘measurement period’ (which cannot exceed one year from the acquisition date) about facts and circumstances that existed at the acquisition date.
The subsequent accounting for changes in the fair value of the contingent consideration that do not qualify as measurement period adjustments depends on how the contingent consideration is classified. Contingent consideration that is classified as equity is not remeasured at subsequent reporting dates and its subsequent settlement is accounted for within equity. Other contingent consideration is remeasured to fair value at subsequent reporting dates with changes in fair value recognised in profit or loss.
When a business combination is achieved in stages, the Group’s previously held interests (including joint operations) in the acquired entity are remeasured to its acquisition-date fair value and the resulting gain or loss, if any, is recognised in profit or loss. Amounts arising from interests in the acquiree prior to the acquisition date that have previously been recognised in other comprehensive income are reclassified to profit or loss, where such treatment would be appropriate if that interest were disposed of.
If the initial accounting for a business combination is incomplete by the end of the reporting period in which the combination occurs, the Group reports provisional amounts for the items for which the accounting is incomplete. Those provisional amounts are adjusted during the measurement period (see above), or additional assets or liabilities are recognised, to reflect new information obtained about facts and circumstances that existed as of the acquisition date that, if known, would have affected the amounts recognised as of that date.
2.3.2 Basis of consolidation
+
The consolidated financial statements incorporate the financial statements of the Company and entities controlled by the Group made up to 31 December each year. Control is achieved when the Group:
- has the power over the investee;
- is exposed, or has rights, to variable returns from its involvement with the investee; and
- has the ability to use its power to affects its returns.
The Group reassesses whether or not it controls an investee if facts and circumstances indicate that there are changes to one or more of the three elements of control listed above.
When the Group has less than a majority of the voting rights of an investee, it considers that it has power over the investee when the voting rights are sufficient to give it the practical ability to direct the relevant activities of the investee unilaterally. The Group considers all relevant facts and circumstances in assessing whether or not the Group’s voting rights in an investee are sufficient to give it power, including:
- The size of the Group’s holding of voting rights relative to the size and dispersion of holdings of the other vote holders;
- Potential voting rights held by the Group, other vote holders or other parties;
- Rights arising from other contractual arrangements; and
- Any additional facts and circumstances that indicate that the Group has, or does not have, the current ability to direct the relevant activities at the time that decisions need to be made, including voting patterns at previous shareholders’ meetings.
Consolidation of a subsidiary begins when the Group obtains control over the subsidiary and ceases when the Group loses control of the subsidiary. Specifically, the results of subsidiaries acquired or disposed of during the year are included in profit or loss from the date the Group gains control until the date when the Group ceases to control the subsidiary.
Where necessary, adjustments are made to the financial statements of subsidiaries to bring the accounting policies used into line with the Group’s accounting policies.
All intragroup assets and liabilities, equity, income, expenses and cash flows relating to transactions between the members of the Group are eliminated on consolidation.
Non-controlling interests in subsidiaries are identified separately from the Group’s equity therein. Those interests of non-controlling shareholders that are present ownership interests entitling their holders to a proportionate share of net assets upon liquidation may initially be measured at fair value or at the non-controlling interests’ proportionate share of the fair value of the acquiree’s identifiable net assets. The choice of measurement is made on an acquisitionby-acquisition basis. Other non-controlling interests are initially measured at fair value. Subsequent to acquisition, the carrying amount of non-controlling interests is the amount of those interests at initial recognition plus the noncontrolling interests’ share of subsequent changes in equity.
Profit or loss and each component of other comprehensive income are attributed to the owners of the Group and to the non-controlling interests. Total comprehensive income of the subsidiaries is attributed to the owners of the Company and to the non-controlling interests even if this results in the non-controlling interests having a deficit balance.
Changes in the Group’s interests in subsidiaries that do not result in a loss of control are accounted for as equity transactions. The carrying amount of the Group’s interests and the non-controlling interests are adjusted to reflect the changes in their relative interests in the subsidiaries. Any difference between the amount by which the noncontrolling interests are adjusted and the fair value of the consideration paid or received is recognised directly in equity and attributed to the owners of the Company.
When the Group loses control of a subsidiary, the gain or loss on disposal recognised in profit or loss is calculated as the difference between (i) the aggregate of the fair value of the consideration received and the fair value of any retained interest and (ii) the previous carrying amount of the assets (including goodwill), less liabilities of the subsidiary and any non-controlling interests. All amounts previously recognised in other comprehensive income in relation to that subsidiary are accounted for as if the Group had directly disposed of the related assets or liabilities of the subsidiary (i.e. reclassified to profit or loss or transferred to another category of equity as required/permitted by applicable IFRS Standards). The fair value of any investment retained in the former subsidiary at the date when control is lost is regarded as the fair value on initial recognition for subsequent accounting under IFRS 9 when applicable, or the cost on initial recognition of an investment in an associate or a joint venture.
2.3.3 Financial instruments
+
Financial assets and financial liabilities are recognised in the Group’s statement of financial position when the Group becomes a party to the contractual provisions of the instrument.
Financial assets and financial liabilities are initially measured at fair value. Transaction costs that are directly attributable to the acquisition or issue of financial assets and financial liabilities (other than financial assets and financial liabilities at fair value through profit or loss) are added to or deducted from the fair value of the financial assets or financial liabilities, as appropriate, on initial recognition. Transaction costs directly attributable to the acquisition of financial assets or financial liabilities at fair value through profit or loss are recognised immediately in the statement of profit or loss.
Financial assets
All regular way purchases or sales of financial assets are recognised and derecognised on a trade date basis. Regular way purchases or sales are purchases or sales of financial assets that require delivery of assets within the time frame established by regulation or convention in the marketplace.
All recognised financial assets are measured subsequently in their entirety at either amortised cost or fair value, depending on the classification of the financial assets.
Classification of financial assets
(i) Debt instruments designated at amortised cost
Debt instruments that meet the following conditions are measured subsequently at amortised cost:
- the financial asset is held within a business model whose objective is to hold financial assets in order to collect contractual cash flows; and
- the contractual terms of the financial asset give rise on specified dates to cash flows that are solely payments of principal and interest on the principal amount outstanding.
Amortised cost and effective interest rate method
The effective interest method is a method of calculating the amortised cost of a debt instrument and of allocating interest income over the relevant period.
For financial instruments other than purchased or originated credit-impaired financial assets (i.e. assets that are credit-impaired on initial recognition), the effective interest rate is the rate that exactly discounts estimated future cash receipts (including all fees and points paid or received that form an integral part of the effective interest rate, transaction costs and other premiums or discounts) excluding expected credit losses, through the expected life of the debt instrument, or, where appropriate, a shorter period, to the gross carrying amount of the debt instrument on initial recognition. For purchased or originated credit-impaired financial assets, a credit-adjusted effective interest rate is calculated by discounting the estimated future cash flows, including expected credit losses, to the amortised cost of the debt instrument on initial recognition.
The amortised cost of a financial asset is the amount at which the financial asset is measured at initial recognition minus the principal repayments, plus the cumulative amortisation using the effective interest method of any difference between that initial amount and the maturity amount, adjusted for any loss allowance.
Interest income is recognised using the effective interest method for debt instruments measured subsequently at amortised cost and at FVOCI. For financial instruments other than purchased or originated credit-impaired financial assets, interest income is calculated by applying the effective interest rate to the gross carrying amount of a financial asset, except for financial assets that have subsequently become credit-impaired (see below). For financial assets that have subsequently become credit-impaired, interest income is recognised by applying the effective interest rate to the amortised cost of the financial asset. If, in subsequent reporting periods, the credit risk on the credit-impaired financial instrument improves so that the financial asset is no longer credit-impaired, interest income is recognised by applying the effective interest rate to the gross carrying amount of the financial asset.
For purchased or originated credit-impaired financial assets, the Group recognises interest income by applying the credit-adjusted effective interest rate to the amortised cost of the financial asset from initial recognition. The calculation does not revert to the gross basis even if the credit risk of the financial asset subsequently improves so that the financial asset is no longer credit-impaired.
Interest income is recognised in profit or loss and is included in the “interest income” line item.
(ii) Equity instruments designated as at FVOCI
On initial recognition, the Group may make an irrevocable election (on an instrument-by-instrument basis) to designate investments in equity instruments as at FVOCI. Designation at FVOCI is not permitted if the equity investment is held for trading or if it is contingent consideration recognised by an acquirer in a business combination.
Investments in equity instruments at FVOCI are initially measured at fair value plus transaction costs. Subsequently, they are measured at fair value with gains and losses arising from changes in fair value recognised in other comprehensive income and accumulated in the investments revaluation reserve. The cumulative gain or loss will not be reclassified to profit or loss on disposal of the equity investments, instead, they will be transferred to retained earnings.
Dividends on these investments in equity instruments are recognised in profit or loss in accordance with IFRS 9, unless the dividends clearly represent a recovery of part of the cost of the investment. Dividends are included in the ‘investment income’ line item in profit or loss.
(iii) Financial assets at FVTPL
Financial assets that do not meet the criteria for being measured at amortised cost or FVOCI are measured at FVTPL. Specifically:
- Investments in equity instruments are classified as at FVTPL, unless the Group designates an equity investment that is neither held for trading nor a contingent consideration arising from a business combination as at FVOCI on initial recognition.
- Debt instruments that do not meet the amortised cost criteria or the FVOCI criteria are classified as at FVTPL. In addition, debt instruments that meet either the amortised cost criteria or the FVOCI criteria may be designated as at FVTPL upon initial recognition if such designation eliminates or significantly reduces a measurement or recognition inconsistency (‘accounting mismatch’) that would arise from measuring assets or liabilities or recognising the gains and losses on them on different bases. The Group has not designated any debt instruments as at FVTPL.
Financial assets at FVTPL are measured at fair value at the end of each reporting period, with any fair value gains or losses recognised in profit or loss.
Impairment of financial assets
The Group recognises a loss allowance for expected credit losses on investments in debt instruments that are measured at amortised cost or at FVOCI, trade receivables, contract assets, as well as on financial guarantee contracts. The amount of expected credit losses is updated at each reporting date to reflect changes in credit risk since initial recognition of the respective financial instrument.
The Group always recognises lifetime ECL for trade receivables and contract assets. The expected credit losses on these financial assets are estimated using a provision matrix based on the Group’s historical credit loss experience, adjusted for factors that are specific to the debtors, general economic conditions and an assessment of both the current as well as the forecast direction of conditions at the reporting date, including time value of money where appropriate.
For all other financial instruments, the Group recognises lifetime ECL when there has been a significant increase in credit risk since initial recognition. However, if the credit risk on the financial instrument has not increased significantly since initial recognition, the Group measures the loss allowance for that financial instrument at an amount equal to 12-month ECL. The assessment of whether lifetime ECL should be recognised is based on significant increases in the likelihood or risk of a default occurring since initial recognition instead of on evidence of a financial asset being creditimpaired at the reporting date.
Lifetime ECL represents the expected credit losses that will result from all possible default events over the expected life of a financial instrument. In contrast, 12-month ECL represents the portion of lifetime ECL that is expected to result from default events on a financial instrument that are possible within 12 months after the reporting date.
(i) Significant increase in credit risk
In assessing whether the credit risk on a financial instrument has increased significantly since initial recognition, the Group compares the risk of a default occurring on the financial instrument as at the reporting date with the risk of a default occurring on the financial instrument as at the date of initial recognition. In making this assessment, the Group considers both quantitative and qualitative information that is reasonable and supportable, including historical experience and forward-looking information that is available without undue cost or effort.
For financial guarantee contracts, the date that the Group becomes a party to the irrevocable commitment is considered to be the date of initial recognition for the purposes of assessing the financial instrument for impairment. In assessing whether there has been a significant increase in the credit risk since initial recognition of a financial guarantee contracts, the Group considers the changes in the risk that the specified debtor will default on the contract.
The Group regularly monitors the effectiveness of the criteria used to identify whether there has been a significant increase in credit risk and revises them as appropriate to ensure that the criteria are capable of identifying significant increase in credit risk before the amount becomes past due.
The Group assumes that the credit risk on a financial instrument has not increased significantly since initial recognition if the financial instrument is determined to have low credit risk at the reporting date. A financial instrument is determined to have low credit risk if:
- The financial instrument has a low risk of default,
- The borrower has a strong capacity to meet its contractual cash flow obligations in the near term, and
- Adverse changes in economic and business conditions in the longer term may, but will not necessarily, reduce the ability of the borrower to fulfil its contractual cash flow obligations.
(ii) Definition of default
The Group considers a financial asset to be in default when the borrower is unlikely to pay its credit obligations to the Group in full, there is sufficient doubt about the ultimate collectability; or the customer is past due for more than 90 days.
(iii) Credit-impaired financial assets
A financial asset is credit-impaired when one or more events that have a detrimental impact on the estimated future cash flows of that financial asset have occurred. Evidence that a financial asset is credit-impaired includes observable data about the following events:
- significant financial difficulty of the issuer or the borrower;
- a breach of contract, such as a default or past due event (see (ii) above);
- the lender(s) of the borrower, for economic or contractual reasons relating to the borrower’s financial difficulty, having granted to the borrower a concession(s) that the lender(s) would not otherwise consider;
- it is becoming probable that the borrower will enter bankruptcy or other financial reorganisation; or
- the disappearance of an active market for that financial asset because of financial difficulties.
(iv) Write-off policy
The Group writes off a financial asset when there is information indicating that the counterparty is in severe financial difficulty and there is no realistic prospect of recovery.
(v) Measurement and recognition of expected credit losses
The measurement of expected credit losses is a function of the probability of default, loss given default (i.e. the magnitude of the loss if there is a default) and the exposure at default. The assessment of the probability of default and loss given default is based on historical data adjusted by forward-looking information as described above. As for the exposure at default, for financial assets, this is represented by the assets’ gross carrying amount at the reporting date; for financial guarantee contracts, the exposure includes the amount drawn down as at the reporting date, together with any additional amounts expected to be drawn down in the future by default date determined based on historical trend, the Group’s understanding of the specific future financing needs of the debtors, and other relevant forward-looking information.
For financial assets, the expected credit loss is estimated as the difference between all contractual cash flows that are due to the Group in accordance with the contract and all the cash flows that the Group expects to receive, discounted at the original effective interest rate.
Derecognition of financial assets
The Group derecognises a financial asset only when the contractual rights to the cash flows from the asset expire, or when it transfers the financial asset and substantially all the risks and rewards of ownership of the asset to another entity. If the Group neither transfers nor retains substantially all the risks and rewards of ownership and continues to control the transferred asset, the Group recognises its retained interest in the asset and an associated liability for amounts it may have to pay. If the Group retains substantially all the risks and rewards of ownership of a transferred financial asset, the Group continues to recognise the financial asset and also recognises a collateralised borrowing for the proceeds received.
On derecognition of a financial asset measured at amortised cost, the difference between the asset’s carrying amount and the sum of the consideration received and receivable is recognised in profit or loss. In addition, on derecognition of an investment in a debt instrument classified as at FVOCI, the cumulative gain or loss previously accumulated in the investments revaluation reserve is reclassified to profit or loss. In contrast, on derecognition of an investment in equity instrument which the Group has elected on initial recognition to measure at FVOCI, the cumulative gain or loss previously accumulated in the investments revaluation reserve is not reclassified to profit or loss, but is transferred to retained earnings.
Financial liabilities
Financial liabilities measured subsequently at amortised cost.
Financial liabilities are measured subsequently at amortised cost using the effective interest method. The effective interest method is a method of calculating the amortised cost of a financial liability and of allocating interest expense over the relevant period. The effective interest rate is the rate that exactly discounts estimated future cash payments (including all fees paid or received that form an integral part of the effective interest rate, transaction costs and other premiums or discounts) through the expected life of the financial liability, or (where appropriate) a shorter period, to the amortised cost of a financial liability.
Derecognition of financial liabilities
The Group derecognises financial liabilities when, and only when, the Group’s obligations are discharged, cancelled or have expired. The difference between the carrying amount of the financial liability derecognised and the consideration paid and payable is recognised in profit or loss.
Financial guarantee contract liabilities
A financial guarantee contract is a contract that requires the issuer to make specified payments to reimburse the holder for a loss it incurs because a specified debtor fails to make payments when due in accordance with the terms of a debt instrument.
Financial guarantee contract liabilities are measured initially at their fair values and, if not designated as at FVTPL and do not arise from a transfer of an asset, are measured subsequently at the higher of:
- The amount of the loss allowance determined in accordance with IFRS 9 (see financial assets above)
- The amount recognised initially less, where appropriate, cumulative amortisation recognised in accordance with the revenue recognition policies.
Derivative financial instruments and hedging activities
The Group enters into derivative financial instruments to manage its exposure to interest rate. Derivatives are recognised initially at fair value at the date a derivative contract is entered into and are subsequently remeasured to their fair value at each reporting date. The resulting gain or loss is recognised in profit or loss immediately unless the derivative is designated and effective as a hedging instrument, in which event the timing of the recognition in profit or loss depends on the nature of the hedge relationship.
A derivative with a positive fair value is recognised as a financial asset whereas a derivative with a negative fair value is recognised as a financial liability. Derivatives are not offset in the financial statements unless the Group has both a legally enforceable right and intention to offset.
Hedge accounting
For hedge accounting, the Group designates derivatives as either hedges of the fair value of recognized assets or liabilities or a firm commitment (fair value hedge); or hedges of a particular risk associated with a recognized asset or liability or a highly probable forecast transaction (cash flow hedge) or hedges of a net investment in a foreign operation (net investment hedge).
At the inception of the hedge relationship, the Group documents the relationship between the hedging instrument and the hedged item, along with its risk management objectives and its strategy for undertaking various hedge transactions. Furthermore, at the inception of the hedge and on an ongoing basis, the Group documents whether the hedging instrument is effective in offsetting changes in fair values or cash flows of the hedged item attributable to the hedged risk, which is when the hedging relationships meet all of the following hedge effectiveness requirements:
- there is an economic relationship between the hedged item and the hedging instrument;
- the effect of credit risk does not dominate the value changes that result from that economic relationship; and
- the hedge ratio of the hedging relationship is the same as that resulting from the quantity of the hedged item that the Group actually hedges and the quantity of the hedging instrument that the Group actually uses to hedge that quantity of hedged item.
If a hedging relationship ceases to meet the hedge effectiveness requirement relating to the hedge ratio but the risk management objective for that designated hedging relationship remains the same, the Group adjusts the hedge ratio of the hedging relationship (i.e. rebalances the hedge) so that it meets the qualifying criteria again.
Fair value hedges
The fair value change on qualifying hedging instruments is recognised in profit or loss except when the hedging instrument hedges an equity instrument designated at FVOCI in which case it is recognised in other comprehensive income. The carrying amount of a hedged item not already measured at fair value is adjusted for the fair value change attributable to the hedged risk with a corresponding entry in profit or loss. For debt instruments measured at FVOCI, the carrying amount is not adjusted as it is already at fair value, but the hedging gain or loss is recognised in profit or loss instead of other comprehensive income. When the hedged item is an equity instrument designated at FVOCI, the hedging gain or loss remains in other comprehensive income to match that of the hedging instrument. Where hedging gains or losses are recognised in profit or loss, they are recognised in the same line as the hedged item.
The Group discontinues hedge accounting only when the hedging relationship (or a part thereof) ceases to meet the qualifying criteria (after rebalancing, if applicable). This includes instances when the hedging instrument expires or is sold, terminated or exercised. The discontinuation is accounted for prospectively. The fair value adjustment to the carrying amount of the hedged item arising from the hedged risk is amortised to profit or loss from that date.
Cash flow hedges
The effective portion of changes in the fair value of derivatives and other qualifying hedging instruments that are designated and qualify as cash flow hedges is recognised in other comprehensive income and accumulated under the heading of cash flow hedging reserve, limited to the cumulative change in fair value of the hedged item from inception of the hedge. The gain or loss relating to the ineffective portion is recognised immediately in profit or loss, and is included in the ‘other gains and losses’ line item.
Amounts previously recognised in other comprehensive income and accumulated in equity are reclassified to profit or loss in the periods when the hedged item affects profit or loss, in the same line as the recognised hedged item. However, when the hedged forecast transaction results in the recognition of a non‑financial asset or a non‑financial liability, the gains and losses previously recognised in other comprehensive income and accumulated in equity are removed from equity and included in the initial measurement of the cost of the non‑financial asset or non‑financial liability. This transfer does not affect other comprehensive income. Furthermore, if the Group expects that some or all of the loss accumulated in the cash flow hedging reserve will not be recovered in the future, that amount is immediately reclassified to profit or loss.
The Group discontinues hedge accounting only when the hedging relationship (or a part thereof) ceases to meet the qualifying criteria (after rebalancing, if applicable). This includes instances when the hedging instrument expires or is sold, terminated or exercised. The discontinuation is accounted for prospectively. Any gain or loss recognised in other comprehensive income and accumulated in cash flow hedge reserve at that time remains in equity and is reclassified to profit or loss when the forecast transaction occurs. When a forecast transaction is no longer expected to occur, the gain or loss accumulated in cash flow hedge reserve is reclassified immediately to profit or loss.
Hedges of net investments in foreign operations
Hedges of net investments in foreign operations are accounted for similarly to cash flow hedges. Any gain or loss on the foreign currency forward contracts relating to the effective portion of the hedge is recognised in other comprehensive income and accumulated in the foreign currency translation reserve. The gain or loss relating to the ineffective portion is recognised immediately in profit or loss, and is included in the ‘other gains and losses’ line item. Gains and losses on the hedging instrument accumulated in the foreign currency translation reserve are reclassified to profit or loss on the disposal or partial disposal of the foreign operation.
Offsetting financial assets and financial liabilities
Financial assets and financial liabilities are offset and reported on a net basis in the accompanying consolidated statement of financial position when a legally enforceable right to set off such amounts exists and when the Group intends to settle on a net basis or to realise the assets and settle the liabilities simultaneously.
2.3.4 Cash and cash equivalents
+
Cash on hand, demand and time deposits with banks whose original maturities do not exceed three months are classified as cash and cash equivalents in the consolidated statement of cash flows.
2.3.5 Inventories
+
Inventories are stated at the lower of cost and net realisable value. Cost comprises direct materials and, where applicable, direct labour costs and those overheads that have been incurred in bringing the inventories to their present location and condition. Cost is calculated using the weighted average cost method. Net realisable value represents the estimated selling price less all estimated costs of completion and costs to be incurred in marketing, selling and distribution.
2.3.6 Investments in associates and joint ventures
+
An associate is an entity over which the Group has significant influence and that is neither a subsidiary nor an interest in a joint venture. Significant influence is the power to participate in the financial and operating policy decisions of the investee but is not control or joint control over those policies.
A joint venture is a joint arrangement whereby the parties that have joint control of the arrangement have rights to the net assets of the joint arrangement. Joint control is the contractually agreed sharing of control of an arrangement, which exists only when decisions about the relevant activities require unanimous consent of the parties sharing control.
The results and assets and liabilities of associates or joint ventures are incorporated in these financial statements using the equity method of accounting, except when the investment is classified as held for sale, in which case it is accounted for in accordance with IFRS 5.
Under the equity method, an investment in an associate or a joint venture is recognised initially in the consolidated statement of financial position at cost and adjusted thereafter to recognise the Group’s share of the profit or loss and other comprehensive income of the associate or joint venture. When the Group’s share of losses of an associate or a joint venture exceeds the Group’s interest in that associate or joint venture (which includes any long-term interests that, in substance, form part of the Group’s net investment in the associate or joint venture), the Group discontinues recognising its share of further losses. Additional losses are recognised only to the extent that the Group has incurred legal or constructive obligations or made payments on behalf of the associate or joint venture.
An investment in an associate or a joint venture is accounted for using the equity method from the date on which the investee becomes an associate or a joint venture. On acquisition of the investment in an associate or a joint venture, any excess of the cost of the investment over the Group’s share of the net fair value of the identifiable assets and liabilities of the investee is recognised as goodwill, which is included within the carrying amount of the investment. Any excess of the Group’s share of the net fair value of the identifiable assets and liabilities over the cost of the investment, after reassessment, is recognised immediately in profit or loss in the period in which the investment is acquired.
The requirements of IAS 36 are applied to determine whether it is necessary to recognise any impairment loss with respect to the Group’s investment in an associate or a joint venture. When necessary, the entire carrying amount of the investment (including goodwill) is tested for impairment in accordance with IAS 36 as a single asset by comparing its recoverable amount (higher of value in use and fair value less costs of disposal) with its carrying amount. Any impairment loss recognised is not allocated to any asset, including goodwill that forms part of the carrying amount of the investment. Any reversal of that impairment loss is recognised in accordance with IAS 36 to the extent that the recoverable amount of the investment subsequently increases.
The Group discontinues the use of the equity method from the date when the investment ceases to be an associate or a joint venture. When the Group retains an interest in the former associate or a joint venture and the retained interest is a financial asset, the Group measures the retained interest at fair value at that date and the fair value is regarded as its fair value on initial recognition in accordance with IFRS 9. The difference between the carrying amount of the associate or a joint venture at the date the equity method was discontinued, and the fair value of any retained interest and any proceeds from disposing of a part interest in the associate or a joint venture is included in the determination of the gain or loss on disposal of the associate or joint venture. In addition, the Group accounts for all amounts previously recognised in other comprehensive income in relation to that associate on the same basis as would be required if that associate had directly disposed of the related assets or liabilities. Therefore, if a gain or loss previously recognised in other comprehensive income by that associate or joint venture would be reclassified to profit or loss on the disposal of the related assets or liabilities, the Group reclassifies the gain or loss from equity to profit or loss (as a reclassification adjustment) when the associate or joint venture is disposed of.
When the Group reduces its ownership interest in an associate or a joint venture but the Group continues to use the equity method, the Group reclassifies to profit or loss the proportion of the gain or loss that had previously been recognised in other comprehensive income relating to that reduction in ownership interest if that gain or loss would be reclassified to profit or loss on the disposal of the related assets or liabilities.
When a Group entity transacts with an associate or a joint venture of the Group, profits and losses resulting from the transactions with the associate or joint venture are recognized in the Group’s consolidated financial statements only to the extent of interests in the associate or joint venture that are not related to the Group. The Group has elected to apply this accounting policy in situation where it ceases to have control of a subsidiary as a result of selling its controlling interest to an existing associate or joint venture.
The Group applies IFRS 9, including the impairment requirements, to long-term interests in an associate or joint venture to which the equity method is not applied and which form part of the net investment in the investee. Furthermore, in applying IFRS 9 to long-term interests, the Group does not take into account adjustments to their carrying amount required by IAS 28 (i.e. adjustments to the carrying amount of long-term interests arising from the allocation of losses of the investee or assessment of impairment in accordance with IAS 28).
2.3.7 Property and equipment
+
Property and equipment are stated at cost less accumulated depreciation and accumulated impairment losses. Freehold land is not depreciated.
Property and equipment are depreciated on a straight-line basis over their estimated economic useful lives, which are as follows:
These assets are reviewed periodically for impairment. If there is an indication that the carrying value of an asset is greater than its recoverable amount, the asset is written down to its recoverable amount and the resultant impairment loss is taken to the consolidated statement of profit or loss. The residual value, useful lives and methods of depreciation are reviewed, and adjusted if appropriate, at each financial year end.
Assets in hyper inflationary economies are restated by applying the change in the general price indices from the date of acquisition to the current reporting date. Depreciation on these assets are based on the restated amounts.
2.3.8 Intangible assets and goodwill
+
Intangible assets acquired separately
Intangible assets with finite useful lives that are acquired separately are carried at cost less accumulated amortisation and accumulated impairment losses. Amortisation is recognised on a straight-line basis over their estimated useful lives which are disclosed in note 12. The estimated useful life and amortisation method are reviewed at the end of each reporting period, with the effect of any changes in estimate being accounted for on a prospective basis. Intangible assets with indefinite useful lives that are acquired separately are carried at cost less accumulated impairment losses.
Intangible assets acquired in a business combination
Intangible assets acquired in a business combination and recognised separately from goodwill are recognized initially at their fair value at the acquisition date (which is regarded as their cost).
Subsequent to initial recognition, intangible assets acquired in a business combination are reported at cost less accumulated amortisation and accumulated impairment losses, on the same basis as intangible assets that are acquired separately.
Reacquired rights
These represents rights which were previously granted to the acquiree to use one or more of the recognized or unrecognized assets of the acquirer, but reacquired as part of a business combination. These reacquired rights are measured on the basis of the remaining contractual term of the related contract regardless of whether market participants would consider potential contractual renewals of the contract or other binding arrangement in determining its fair value.
A reacquired right is an identifiable intangible asset and is recognized separately from goodwill and are amortised over the remaining contractual period in which the right was granted.
IRUs
IRU are the rights to use a portion of the capacity of a terrestrial or submarine transmission cable granted for a fixed period. IRUs are recognized at cost as an asset when the Group has the specific indefeasible right to use an identified portion of the underlying asset, generally optical fibers and the duration of the right is for the major part of the underlying asset’s economic life. They are amortised on a straight line basis over the shorter of the expected period of use and the life of the contract which ranges between 10 to 20 years.
De-recognition of intangible assets
An intangible asset is derecognised on disposal, or when no future economic benefits are expected from use or disposal. Gains or losses arising from derecognition of an intangible asset, measured as the difference between the net disposal proceeds and the carrying amount of the asset, are recognised in profit or loss when the asset is derecognised.
Goodwill
Goodwill is initially recognised and measured as set out in note 2.3.1 above.
Goodwill is not amortised but is reviewed for impairment at least annually. For the purpose of impairment testing, goodwill is allocated to each of the Group’s cash-generating units (or groups of cash-generating units) expected to benefit from the synergies of the combination. Cash-generating units to which goodwill has been allocated are tested for impairment annually, or more frequently when there is an indication that the unit may be impaired. If the recoverable amount of the cash-generating unit is less than the carrying amount of the unit, the impairment loss is allocated first to reduce the carrying amount of any goodwill allocated to the unit and then to the other assets of the unit pro-rata on the basis of the carrying amount of each asset in the unit. An impairment loss recognised for goodwill is not reversed in a subsequent period.
The recoverable amount is the higher of fair value less costs to sell and value in use. In assessing value in use, the estimated future cash flows are discounted to their present value using a pre-tax discount rate that reflects current market assessments of the time value of money and risk specific to the asset for which the estimates of future cash flows have not been adjusted. The Group prepares formal four to five year plans for its businesses. These plans are used for the value in use calculation. Long range growth rates are used for cash flows into perpetuity beyond the four to five year period. Fair value less costs to sell is determined with reference to published quoted prices.
On disposal of a cash-generating unit, the attributable amount of goodwill is included in the determination of the profit or loss on disposal.
The Group’s policy for goodwill arising on the acquisition of an associate is described in note 2.3.6 above.
2.3.9 Impairment of property, plant and equipment right-of-use of assets and intangible assets excluding goodwill
+
At each reporting date, the Group reviews the carrying amounts of its property, plant and equipment, right-of-use of assets and intangible assets to determine whether there is any indication that those assets have suffered an impairment loss. If any such indication exists, the recoverable amount of the asset is estimated to determine the extent of the impairment loss (if any). Where the asset does not generate cash flows that are independent from other assets, the Group estimates the recoverable amount of the cash-generating unit to which the asset belongs. When a reasonable and consistent basis of allocation can be identified, corporate assets are also allocated to individual cash-generating units, or otherwise they are allocated to the smallest group of cash-generating units for which a reasonable and consistent allocation basis can be identified.
Intangible assets with an indefinite useful life are tested for impairment at least annually and whenever there is an indication at the end of a reporting period that the asset may be impaired.
Recoverable amount is the higher of fair value less costs of disposal and value in use. In assessing value in use, the estimated future cash flows are discounted to their present value using a pre-tax discount rate that reflects current market assessments of the time value of money and the risks specific to the asset for which the estimates of future cash flows have not been adjusted.
If the recoverable amount of an asset (or cash-generating unit) is estimated to be less than its carrying amount, the carrying amount of the asset (or cash-generating unit) is reduced to its recoverable amount. An impairment loss is recognised immediately in profit or loss.
Where an impairment loss subsequently reverses, the carrying amount of the asset (or cash-generating unit) is increased to the revised estimate of its recoverable amount, but so that the increased carrying amount does not exceed the carrying amount that would have been determined had no impairment loss been recognised for the asset (or cash-generating unit) in prior years. A reversal of an impairment loss is recognised immediately in profit or loss to the extent that it eliminates the impairment loss which has been recognised for the asset in prior years.
2.3.10 Non-current assets held for sale
+
Non-current assets (and disposal groups) classified as held for sale are measured at the lower of carrying amount and fair value less costs to sell.
Non-current assets and disposal groups are classified as held for sale if their carrying amount will be recovered through a sale transaction rather than through continuing use. This condition is regarded as met only when the sale is highly probable and the asset (or disposal group) is available for immediate sale in its present condition. Management must be committed to the sale which should be expected to qualify for recognition as a completed sale within one year from the date of classification.
When the Group is committed to a sale plan involving loss of control of a subsidiary, all of the assets and liabilities of that subsidiary are classified as held for sale when the criteria described above are met, regardless of whether the Group will retain a non-controlling interest in its former subsidiary after the sale.
When the Group is committed to a sale plan involving disposal of an investment in an associate or, a portion of an investment in an associate, the investment, or the portion of the investment in the associate, that will be disposed of is classified as held for sale when the criteria described above are met. The Group then ceases to apply the equity method in relation to the portion that is classified as held for sale. Any retained portion of an investment in an associate that has not been classified as held for sale continues to be accounted for using the equity method.
2.3.11 Fair value measurement
+
Fair values
Fair value is the price that would be received to sell an asset or paid to transfer a liability in an orderly transaction between market participants at the measurement date. The fair value measurement is based on the presumption that the transaction to sell the asset or transfer the liability takes place either:
- In the principal market for the asset or liability, or
- In the absence of a principal market, in the most advantageous market for the asset or liability.
The principal or the most advantageous market must be accessible to by the Group.
The fair value of an asset or a liability is measured using the assumptions that market participants would use when pricing the asset or liability, assuming that market participants act in their economic best interest.
A fair value measurement of a non-financial asset takes into account a market participant’s ability to generate economic benefits by using the asset in its highest and best use or by selling it to another market participant that would use the asset in its highest and best use.
The Group uses valuation techniques that are appropriate in the circumstances and for which sufficient data are available to measure fair value, maximizing the use of relevant observable inputs and minimizing the use of unobservable inputs.
All assets and liabilities for which fair value is measured or disclosed in the consolidated financial statements are categorized within the fair value hierarchy, described as follows, based on the lowest level input that is significant to the fair value measurement as a whole:
- Level 1 – Quoted (unadjusted) market prices in active markets for identical assets or liabilities.
- Level 2 – Valuation techniques for which the lowest level input that is significant to the fair value measurement is directly or indirectly observable.
- Level 3 – Valuation techniques for which the lowest level input that is significant to the fair value measurement is unobservable.
For financial instruments quoted in an active market, fair value is determined by reference to quoted market prices. Bid prices are used for assets and offer prices are used for liabilities.
For unquoted financial instruments, fair value is determined by reference to the market value of a similar investment, discounted cash flows, other appropriate valuation models or brokers’ quotes.
For financial instruments carried at amortized cost, the fair value is estimated by discounting future cash flows at the current market rate of return for similar financial instruments.
For assets and liabilities that are recognized in the consolidated financial statements on a recurring basis, the Group determines whether transfers have occurred between levels in the hierarchy by re-assessing categorisation (based on the lowest level input that is significant to the fair value measurement as a whole) at the end of each reporting period.
For the purpose of fair value disclosures, the Group determines classes of assets and liabilities on the basis of the nature, characteristics and risks of the asset or liability and the level of the fair value hierarchy as explained above.
2.3.12 Taxation
+
The income tax expense represents the sum of the tax currently payable and deferred tax.
Current tax
The tax currently payable is based on taxable profit for the year. Taxable profit differs from net profit as reported in profit or loss because it excludes items of income or expense that are taxable or deductible in other years and it further excludes items that are never taxable or deductible. The Group’s liability for current tax is calculated using tax rates that have been enacted or substantively enacted by the end of the reporting period.
A provision is recognised for those matters for which the tax determination is uncertain but it is considered probable that there will be a future outflow of funds to a tax authority. The provisions are measured at the best estimate of the amount expected to become payable. The assessment is based on the judgement of tax professionals within the Group supported by previous experience in respect of such activities and in certain cases based on specialist independent tax advice.
Deferred tax
Deferred tax is the tax expected to be payable or recoverable on differences between the carrying amounts of assets and liabilities in the financial statements and the corresponding tax bases used in the computation of taxable profit, and is accounted for using the liability method. Deferred tax liabilities are generally recognised for all taxable temporary differences and deferred tax assets are recognised to the extent that it is probable that taxable profits will be available against which deductible temporary differences can be utilised. Such assets and liabilities are not recognised if the temporary difference arises from the initial recognition (other than in a business combination) of other assets and liabilities in a transaction that affects neither the taxable profit nor the accounting profit. In addition, a deferred tax liability is not recognised if the temporary difference arises from the initial recognition of goodwill.
Deferred tax liabilities are recognised for taxable temporary differences arising on investments in subsidiaries and associates, and interests in joint ventures, except where the Group is able to control the reversal of the temporary difference and it is probable that the temporary difference will not reverse in the foreseeable future. Deferred tax assets arising from deductible temporary differences associated with such investments and interests are only recognised to the extent that it is probable that there will be sufficient taxable profits against which to utilise the benefits of the temporary differences and they are expected to reverse in the foreseeable future.
The carrying amount of deferred tax assets is reviewed at each reporting date and reduced to the extent that it is no longer probable that sufficient taxable profits will be available to allow all or part of the asset to be recovered.
Deferred tax is calculated at the tax rates that are expected to apply in the period when the liability is settled or the asset is realised based on tax laws and rates that have been enacted or substantively enacted at the reporting date.
The measurement of deferred tax liabilities and assets reflects the tax consequences that would follow from the manner in which the Group expects, at the end of the reporting period, to recover or settle the carrying amount of its assets and liabilities.
Deferred tax assets and liabilities are offset when there is a legally enforceable right to set off current tax assets against current tax liabilities and when they relate to income taxes levied by the same taxation authority and the Group intends to settle its current tax assets and liabilities on a net basis.
Current tax and deferred tax for the year
Current and deferred tax are recognised in profit or loss, except when they relate to items that are recognised in other comprehensive income or directly in equity, in which case, the current and deferred tax are also recognized in other comprehensive income or directly in equity respectively. Where current tax or deferred tax arises from the initial accounting for a business combination, the tax effect is included in the accounting for the business combination.
2.3.13 Provisions
+
Provisions are recognised when the Group has a present obligation (legal or constructive) as a result of a past event, it is probable that the Group will be required to settle that obligation and a reliable estimate can be made of the amount of the obligation.
The amount recognised as a provision is the best estimate of the consideration required to settle the present obligation at the reporting date, taking into account the risks and uncertainties surrounding the obligation. Where a provision is measured using the cash flows estimated to settle the present obligation, its carrying amount is the present value of those cash flows (when the effect of the time value of money is material).
When some or all of the economic benefits required to settle a provision are expected to be recovered from a third party, a receivable is recognised as an asset if it is virtually certain that reimbursement will be received and the amount of the receivable can be measured reliably.
Onerous contracts
Present obligations arising under onerous contracts are recognised and measured as provisions. An onerous contract is considered to exist where the Group has a contract under which the unavoidable costs of meeting the obligations under the contract exceed the economic benefits expected to be received under it.
2.3.14 Post-employment benefits
+
The Group is liable to make defined contributions to State Plans and lump sum payments under defined benefit plans to employees at cessation of employment, in accordance with the laws of the place where they are deemed to be employed. The defined benefit plan is unfunded and is computed as the amount payable to employees as a result of involuntary termination on the consolidated statement of financial position date. This basis is considered to be a reliable approximation of the present value of the final obligation.
2.3.15 Leases
+
The Group as lessee
The Group assesses whether contract is or contains a lease, at inception of the contract. The Group recognises a right-of-use asset and a corresponding lease liability with respect to all lease arrangements in which it is the lessee, except for short-term leases (defined as leases with a lease term of 12 months or less) and leases of low value assets. For these leases, the Group recognises the lease payments as an operating expense on a straight-line basis over the term of the lease unless another systematic basis is more representative of the time pattern in which economic benefits from the leased assets are consumed.
The lease liability is initially measured at the present value of the lease payments that are not paid at the commencement date, discounted by using the rate implicit in the lease. If this rate cannot be readily determined, the Group uses its incremental borrowing rate.
Lease payments included in the measurement of the lease liability comprise:
- Fixed lease payments (including in-substance fixed payments), less any lease incentives;
- Variable lease payments that depend on an index or rate, initially measured using the index or rate at the commencement date;
- The amount expected to be payable by the lessee under residual value guarantees;
- The exercise price of purchase options, if the lessee is reasonably certain to exercise the options; and
- Payments of penalties for terminating the lease, if the lease term reflects the exercise of an option to terminate the lease
The lease liability is presented as a separate line item in the consolidated statement of financial position.
The lease liability is subsequently measured by increasing the carrying amount to reflect interest on the lease liability (using effective interest method) and by reducing the carrying amount to reflect the lease payments made.
The Group remeasures the lease liability (and makes a corresponding adjustment to the related right-of-use asset) whenever:
- The lease term has changed or there is a change in the assessment of exercise of a purchase option, in which case the lease liability is remeasured by discounting the revised lease payments using a revised discount rate.
- The lease payments change due to changes in an index or rate or a change in expected payment under a guaranteed residual value, in which cases the lease liability is remeasured by discounting the revised lease payments using the initial discount rate (unless the lease payments change is due to a change in a floating interest rate, in which case a revise discount rate is used).
- A lease contract is modified and the lease modification is not accounted for as a separate lease, in which case the lease liability is remeasured by discounting the revised lease payments using a revised discount rate.
The Group did not make any such adjustments during the periods presented.
The right-of-use assets comprise the initial measurement of the corresponding lease liability, lease payments made at or before the commencement day, less any lease incentives received and any initial direct costs. They are subsequently measured at cost less accumulated depreciation and impairment losses
The right-of-use assets are depreciated over the shorter period of lease term and useful life of the underlying asset. If a lease transfers ownership of the underlying asset or the cost of the right-of-use of asset reflects that the Group expects to exercise a purchase option, the related right-of-use asset is depreciated over the useful life of the underlying asset. The depreciation starts at the commencement date of the lease.
The right-of-use of assets are presented as a separate line in the statement of financial position.
The Group applies IAS 36 to determine whether a right-of-use asset is impaired and accounts for an identified impairment loss as described in the ‘Impairment of property, plant and equipment right-of-use of assets and intangible assets excluding goodwill’ policy.
Variable rents that do not depend on an index or rate are not included in the measurement of the lease liability and the right-of-use asset. The related payments are recognised as an expense in the period in which the event or condition that triggers those payments occurs.
As a practical expedient, IFRS16 permits a lessee not to separate non-lease components, and instead account for any lease and associated non-lease components as a single arrangement. The Group has used this practical expedient. For a contracts that contain a lease component and one or more additional lease or non-lease components, the Group allocates the consideration in the contract to each lease component on the basis of the relative stand-alone price of the lease component and the aggregate stand-alone price of the non-lease components.
Sale and leaseback
The Group enters into sale and leaseback transactions whereby it sells certain assets to a third-party and immediately leases them back. Where sale proceeds received are judged to reflect the fair value, any gain or loss arising on disposal is recognised in the statement of profit or loss, to the extent that it relates to the rights that have been transferred. Gains and losses that relate to the rights that have been retained are included in the carrying amount of the right of use asset recognised at commencement of the lease. Where sale proceeds received are not at the fair value, any below market terms are recognised as a prepayment of lease payments, and above market terms are recognised as additional financing provided by the lessor.
The Group as lessor
Leases for which the Group is a lessor are classified as finance or operating leases. Whenever the terms of the lease transfer substantially all the risks and rewards of ownership to the lessee, the contract is classified as a finance lease. All other leases are classified as operating leases.
Rental income from operating leases is recognised on a straight-line basis over the term of the relevant lease. Initial direct costs incurred in negotiating and arranging an operating lease are added to the carrying amount of the leased asset and recognised on a straight-line basis over the lease term.
Amounts due from lessees under finance leases are recognised as receivables at the amount of the Group’s net investment in the leases. Finance lease income is allocated to accounting periods so as to reflect a constant periodic rate of return on the Group’s net investment outstanding in respect of the leases.
Subsequent to initial recognition, the Group regularly reviews the estimated unguaranteed residual value and applies the impairment requirements of IFRS 9, recognising an allowance for expected credit losses on the lease receivables.
When a contract includes lease and non-lease components, the Group applies IFRS 15 to allocate consideration under the contract to each component.
2.3.16 Revenue
+
Revenues from operations consist of recurring revenues, such as billings to customers for monthly subscription fees, roaming, leased line and airtime usage fees, and non-recurring revenues, such as one-time connection fees, and telephone equipment and accessory sales.
Handsets and telecommunication services
Revenue from mobile telecommunication services provided to postpaid and prepaid customers is recognized as services are transferred. When the customer performs first, for example, by prepaying its promised consideration, the Group has a contract liability. If the Group performs first by satisfying a performance obligation, the Group has a contract asset. Consideration received from the sale of prepaid credit is recognized as contract liability until such time the customer uses the services when it is recognized as revenue.
The Group provides subsidized handsets to its customers along with mobile telecommunication services. The contract’s transaction price is allocated to each performance obligation based on their relative stand-alone selling price. This results in reallocation of a portion of revenue from trading revenue to service revenue and correspondingly creation of a contract assets. Contract asset represents receivable from customers that has not yet legally come into existence. The standalone selling prices are determined based on observable prices. Revenue from device sales is recognized when the device is delivered to the customer. This usually occurs when a customer signs the contract. For devices sold separately, customer pays in full at the point of sale. Revenue from voice, messaging, internet services etc. are included in the bundled package and are recognized as the services are rendered during the period of the contract.
Value added services – Principal vs. agent
Revenue from value added services (VAS) sharing arrangements depend on the analysis of the facts and circumstances surrounding these transactions. Revenue from VAS is recognized when the Group performs the related service and, depending on the Group’s control or lack of control on the services transferred to the customer, is recognized either at the gross amount billed to the customer or the amount receivable by the Group as commission for facilitating the service.
Significant financing component
If a customer can pay for purchased equipment or services over a period, IFRS 15 requires judgement to determine if the contract includes a significant financing component. If it does, then the transaction price is adjusted to reflect the time value of money.
Commissions and other contract costs
Certain incremental costs incurred in acquiring a contract with a customer is deferred on the consolidated statement of financial position and amortised as revenue is recognised under the related contract; this will generally lead to the later recognition of charges for some commissions payable to third party distributors and employees.
Intermediaries are given incentives by the Group to acquire new customers and upgrade existing customers. Activation commission and renewal commission paid on post-paid connections are amortized over the period of the contract. In case of prepaid customers, commission costs are expensed when incurred. However, the Group may choose to expense such commission costs if the amortization period of the resulting asset is one year or less or if it is not significant.
Customer loyalty programs
The Group operates a customer loyalty program that provides a variety of benefits for customers. The Group allocates the consideration received between products and services in a bundle including loyalty points as separate performance obligation based on their stand-alone selling prices.
Installation and maintenance contracts
The Group also enters into installation and maintenance contracts where the revenue is recognised over time based on the cost-to-completion method. The related costs are recognised in profit or loss when they are incurred. Advances received are included in contract liabilities.
Interest income is recognized on a time proportion basis using the effective yield method and dividend income is recognized when the right to receive payment is established.
The ‘effective interest rate’ is the rate that exactly discounts estimated future cash receipts through the expected life of the financial instrument to the gross carrying amount of the financial asset.
In calculating interest income, the effective interest rate is applied to the gross carrying amount of the asset (when the asset is not credit-impaired). However, for financial assets that have become credit-impaired subsequent to initial recognition, interest income is calculated by applying the effective interest rate to the amortised cost of the financial asset. If the asset is no longer credit-impaired, then the calculation of interest income reverts to the gross basis.
2.3.17 Borrowing costs
+
Borrowing costs directly attributable to the acquisition, construction or production of qualifying assets, which are assets that necessarily take a substantial period of time to get ready for their intended use or sale, are added to the cost of those assets, until such time as the assets are substantially ready for their intended use or sale.
Investment income earned on the temporary investment of specific borrowings pending their expenditure on qualifying assets is deducted from the borrowing costs eligible for capitalisation.
All other borrowing costs are recognised in profit or loss in the period in which they are incurred.
2.3.18 Foreign currencies
+
In preparing the financial statements of the Group entities, transactions in currencies other than the entity’s functional currency (foreign currencies) are recognised at the rates of exchange prevailing on the dates of the transactions. At each reporting date, monetary assets and liabilities that are denominated in foreign currencies are retranslated at the rates prevailing at that date. Non-monetary items carried at fair value that are denominated in foreign currencies are translated at the rates prevailing at the date when the fair value was determined. Non-monetary items that are measured in terms of historical cost in a foreign currency are not retranslated.
Exchange differences are recognised in profit or loss in the period in which they arise except for:
- exchange differences on foreign currency borrowings relating to assets under construction for future productive use, which are included in the cost of those assets when they are regarded as an adjustment to interest costs on those foreign currency borrowings;
- exchange differences on transactions entered into to hedge certain foreign currency risks; and
- exchange differences on monetary items receivable from or payable to a foreign operation for which settlement is neither planned nor likely to occur in the foreseeable future (therefore forming part of the net investment in the foreign operation), which are recognised initially in other comprehensive income and reclassified from equity to profit or loss on disposal or partial disposal of the net investment.
For the purpose of presenting consolidated financial statements, the assets and liabilities of the Group’s foreign operations are translated at exchange rates prevailing on the reporting date. Income and expense items are translated at the average exchange rates for the period, unless exchange rates fluctuate significantly during that period, in which case the exchange rates at the date of transactions are used. Exchange differences arising, if any, are recognised in other comprehensive income and accumulated in a foreign exchange translation reserve (attributed to non-controlling interests as appropriate).
On the disposal of a foreign operation (i.e. a disposal of the Group’s entire interest in a foreign operation, or a disposal involving loss of control over a subsidiary that includes a foreign operation or a partial disposal of an interest in a joint arrangement or an associate that includes a foreign operation of which the retained interest becomes a financial asset), all of the exchange differences accumulated in a foreign exchange translation reserve in respect of that operation attributable to the owners of the Company are reclassified to profit or loss.
In addition, in relation to a partial disposal of a subsidiary that includes a foreign operation that does not result in the Group losing control over the subsidiary, the proportionate share of accumulated exchange differences are reattributed to non-controlling interests and are not recognised in profit or loss. For all other partial disposals (i.e. partial disposals of associates or joint arrangements that do not result in the Group losing significant influence or joint control), the proportionate share of the accumulated exchange differences is reclassified to profit or loss.
Goodwill and fair value adjustments arising on the acquisition of a foreign entity are treated as assets and liabilities of the foreign entity and translated at the closing rate. Exchange differences arising are recognised in other comprehensive income.
2.3.19 Financial reporting in hyperinflationary economies
+
The financial statements of subsidiaries whose functional currencies are the currencies of hyperinflationary economies are adjusted in terms of the measuring unit current at the end of the reporting period.
In the first period of application, the adjustments determined at the beginning of the period are recognized directly in equity as an adjustment to opening retained earnings. In subsequent periods, the prior period adjustments related to components of owners’ equity and differences arising on translation of comparative amounts are accounted for in other comprehensive income.
Items in the consolidated statement of financial position not already expressed in terms of the measuring unit current at the reporting period, such as non-monetary items carried at cost or cost less depreciation, are restated by applying a general price index. The restated cost, or cost less depreciation, of each item is determined by applying to its historical cost and accumulated depreciation the change in a general price index from the date of acquisition to the end of the reporting period. An impairment loss is recognized in profit or loss if the restated amount of a non-monetary item exceeds its estimated recoverable amount.
At the beginning of the first period of application, the components of owners’ equity, except retained earnings, are restated by applying a general price index from the dates the components were contributed or otherwise arose. Restated retained earnings are derived from all other amounts in the restated consolidated statement of financial position. At the end of the first period and in subsequent periods, all components of owners’ equity are restated by applying a general price index from the beginning of the period or the date of contribution, if later.
All items recognized in the income statement are restated by applying the change in the general price index from the dates when the items of income and expenses were initially earned or incurred.
Gains or losses on the net monetary position are recognized in profit or loss.
All items in the consolidated statement of cash flows are expressed in terms of the general price index at the end of the reporting period.
2.3.20 Contingencies
+
Contingent assets are not recognized as an asset until realisation becomes virtually certain. Contingent liabilities, other than those arising on acquisition of subsidiaries, are not recognized as a liability unless as a result of past events it is probable that an outflow of economic resources will be required to settle a present, legal or constructive obligation; and the amount can be reliably estimated. Contingent liabilities arising in a business combination are recognized if their fair value can be measured reliably.
3. Subsidiaries
+
The principal subsidiaries of the Group are:
Pella owns 100% of Jordan Mobile Telecommunications Services Co. JSC – “JMTS”. Al Khatem owns 100% of Atheer. Zain Tech owns 100% of BIOS and 65% of Adfolks.
JMTS, MTCB, Zain Sudan, Zain South Sudan, Atheer and SMTC operate the cellular mobile telecommunications network in Jordan, Bahrain, Sudan, South Sudan, Iraq and the Kingdom of Saudi Arabia (KSA) respectively. Mada Jordan provides WiMAX services in Jordan. Zain Tech provides network consultancy and cloud solutions in MENA region.
SMTC
In July 2018, the Group concluded that it is able to control SMTC through its majority representation on the board of directors and accordingly considered it as a subsidiary effective from that period.
Acquisition of Subsidiaries
ZainTECH
In January 2023, the Group, through Zain Tech, acquired the entire equity interest of BIOS Middle East Holdings Ltd (“BIOS”) for a purchase consideration of AED 158.161 million (KD 13.220 million) (including contingent consideration) of which an amount of AED 126.056 million (KD 10.495 million) was paid during the year. The net cash outflow (net of cash and cash equivalents acquired) on acquisition amounts to AED 120.167 million (KD 10.002 million). BIOS is a company incorporated in UAE having multiple subsidiaries engaged in business of IT related activities and cloud services.
In May 2023, the Group, through Zain Tech, acquired 65% equity interest of Adfolks Software Trading L.L.C (“Adfolks”) for a purchase consideration of AED 14.184 million (KD 1.188 million) of which an amount of AED 10.554 million (KD 0.883 million) was paid during the year. The net cash outflow (net of cash and cash equivalents acquired) on acquisition amounts to AED 8.782 million (KD 0.735 million). Adfolks is a company incorporated in UAE engaged in cloud and related services.
The Group completed the purchase price allocation (PPA) in respect of these acquisitions during the year. The amounts assigned to the identifiable assets acquired and liabilities assumed, as on the acquisition date, are as set out below.
* Intangible assets recognized represents the value of the Customer Relationship that the Group acquired as part of the business combination.
Bookeey
During the year, the Group acquired 83.39% equity interest of Xenon Electronic Payment Company W.L.L (“Bookeey”) for a purchase consideration of KD 2.437 million, which was paid during the year. The net cash outflow (net of cash and cash equivalents acquired) on acquisition amounts to KD 0.205 million. The recognized amounts of net assets of Bookeey as at the date of acquisition was KD 0.675 million, resulting in a goodwill of KD 1.874 million. The provisional values assigned to the identifiable assets and liabilities as at the date of acquisition, are subject to review within one year of acquisition on finalization of the Purchase Price Allocation (PPA). Bookeey is a company incorporated in Kuwait engaged in electronic payment and settlement systems services.
Others
In October 2023, the Group entered into an agreement for acquisition of 100% equity interest of Specialized Technical Services Company (“STS”), a company engaged in providing digital transformation solutions in the Middle East and North Africa, for a purchase consideration of US$ 32 million (KD 9.900 million) (including contingent consideration). This acquisition is subject to regulatory approvals.
Financial support to Group companies
The Group has committed to provide working capital and other financial support to certain subsidiaries including Mobile Telecommunications Company Saudi Arabia (“SMTC”), Zain Jordan (Pella) and Al Khatem (Atheer) whose working capitals are in deficit. Based on business plans, the Group does not expect these conditions will have a material adverse impact on the operations of these Group companies.
4. Cash and bank balances
+
4.1 Cash and bank balances
+
Cash and bank balances include the following cash and cash equivalents:
4.1 Bank balances held in customers’ account
+
Bank balances held in customers’ Account as part of electronic payment services provided by the Group are presented separately from cash and cash equivalents in the statement of financial position of the Group. The regulations in respective locations require that these balances with banks are held in a manner to ensure that these balances are not co-mingled with the Group’s cash and cash equivalents.
During the current year Group management decided to present these Bank balances held in customers account separately from the other bank balances in order to achieve better presentation. The comparative amounts have been reclassified from Cash and cash equivalent to Bank balances held in customers’ account (KD 8.182 million) in line with the current year presentation is not material to the consolidated financial statement of the Group.
5. Trade and other receivables
+
In 2011, the Group paid US$ 473 million (equivalent to KD 144.756 million) to settle the guarantees provided by the Company to lending banks for loans to a founding shareholder of SMTC. The Group has been pursuing legal action for its recovery and in November 2016 the London Arbitration Court upheld the Group’s right to recover the US$ 473 million paid in addition to interest and costs. These amounts are secured by an agreement to transfer to the Group, the founding shareholder’s shares in SMTC, which is currently pledged to the murabaha lenders of SMTC, and the shareholder loan in SMTC owed to the founding shareholder. The Company has initiated the legal procedures necessary to enforce the arbitration award in and outside KSA. In 2020, the courts in KSA rejected the Company’s application to enforce the arbitral award in KSA. During 2020 the Company wrote to Supreme Judicial Counsel requesting that the matter be referred back to the enforcement court for reconsideration. The Supreme Judicial Counsel recommended that MTC file a second reconsideration motion with the Riyad Appeal Court. On 21 June 2022, MTC filed its third reconsideration motion with the Riyadh Appeal Court. On 29 November 2022, the Riyadh Appeal Court dismissed MTC’s motion for reconsideration. MTC is considering its strategy and options for proceeding with enforcement of the award.
On 27 July 2023, MTC filed a petition before the Supreme Judicial Counsel to enforce the award and objecting to the rejection of Riyadh Enforcement Court. As a result, a study by judicial committee has concluded that the Group has the right to enforce the award excluding the interest portion from the total amount, and suggested to the Minister of Justice, President of the Supreme Judicial Counsel (final signatory) that the Group should submit to the court of appeal a petition for reconsideration in this regard.
Subsequently on 15 January 2024, MTC was informed by Supreme Judicial Council that Minister of Justice signed the study ordering the court of appeal to accept a request for reconsideration by the Company and hire an expert to segregate interest from the principal amount.
In 2010, the Group paid US$ 40 million (equivalent to KD 12.232 million) to settle guarantees provided by the Company to lending bank for loans to a founding shareholder of SMTC. In 2013, the Group won a legal action for the recovery of that amount and is currently pursuing further legal action for its implementation in KSA at the High Supreme Court.
Both the above amounts are secured by an agreement to transfer to the Group, the founding shareholder’s shares in SMTC.
The carrying amounts of the Group’s trade and other receivables are denominated in the following currencies:
6. Inventories
+
7. Investment securities
+
Investment securities are denominated in the following currencies:
8. Assets and liabilities of disposal group classified as held for sale
+
Assets and liabilities of disposal group classified as held for sale represent telecom tower assets in Kuwait and KSA classified as held for sale, on the basis of plan to sale and lease back of those assets.
KSA
In 2022, SMTC received board of directors’ approval on the final offers (the “Final Offers”) from the Public Investment Fund (PIF), HRH Prince Saud bin Fahd Bin Abdulaziz, and Sultan Holding Company after completing the due diligence and internal approvals of all parties. The approved final offers were to acquire stakes in SMTC’s towers infrastructure comprising of 8,069 towers, valuing these assets at US$ 807 million (KD 250.089 million). Pursuant to the Final Offers SMTC will own 20% stake in newly formed Tower Company. PIF’s Final Offer also includes a call option that will grant PIF the right to buy the remaining 20% stake from SMTC for a certain amount. Under the terms of the offers, SMTC will sell its passive, physical towers infrastructure and retain all other wireless communication antennas, software, technology, and intellectual property (IPs).
On 28 May 2022, SMTC received a letter from the Communications, Space and Technology Commission (“CST”), which included the CST’s Board of Directors approval for “Zain Business Limited” (a subsidiary of Zain KSA) to acquire aforementioned telecom tower sites owned by SMTC.
During the first quarter ended 31 March 2023 Financial Completion date was triggered and all respective conditions were completed, consequently the passive infrastructure of all the sites were derecognized from the books of the Group. Additionally, and in accordance with the terms and conditions of the Mobile Tower Space use Agreement (“MTSA”) with Golden Lattice Investment Company (“ GLI”), the Group leased back the right to use specified spaces on each site recognizing the Right of Use Assets (“ROU”) and Lease Liability (“LL”) on the same. The total gain recorded from the above transaction was SR 1,191 million (KD 97.631 million).
The ground leases for all sites, whether transferred or yet to be transferred but landlord consent is available, have been accounted in such a manner that the related ROU and LL have been derecognized with any resulting gain or loss recognized in the income statement. For all other cases, the related carrying amounts of ROU and LL have been retained. The total loss on termination due to the above accounting for ground leases amounted to SR 177 million (KD 14.492 million) recorded in the year 2023.
On 19 October 2023 SMTC received a request from PIF to exercise its unconditional call option as per the SHA. The investment in these unquoted equity shares were classified as investment securities at FVTPL in the consolidated statement of financial position. The call option was exercised on 20 November 2023 for a total consideration of SAR 726 million (KD 59.731 million). The gain realized on this sale amounts to SAR 121 million (KD 9.949 million).
Iraq
During 2022, Atheer Telecom Iraq Limited received approval from its board of directors for the sale of its passive tower infrastructure. Under the terms of the offer received, Atheer was to sell and leaseback its passive physical towers infrastructure comprising of 4,604 towers.
In January 2023, Atheer sold and leased back from TTI Holding Limited (TTI, a subsidiary of the Group) 4,604 towers, for an aggregate value of US$ 180 million (KD 55.224 million). This intercompany transaction was eliminated at the Group level.
In July 2023, the Group sold its controlling stake in TTI (including tower infrastructure) to TASC Towers Holding Limited (“TASC”) (an associate of the Group), for a consideration of US$ 238 million (KD 73.469 million). This resulted in a gain of US$ 8.7 million (KD 2.711 million) after elimination of loss resulting from downstream transaction. This includes the impact of reallocating goodwill of US$ 161 million (KD 49.671 million) attributable to tower operations and recycling of $16 million (KD 5.067 million) FCTR to income statement. The consideration was settled by issuing shares of TASC.
Kuwait
Between 2020 and 2022 the Company completed the sale and lease back of 1,398 telecom towers in Kuwait. During August 2023, the Company completed sale and lease back of additional 101 telecom towers in Kuwait for a total sale consideration of US$ 6.409 million (KD 1.974 million). Total gain from this transaction was KD 1.073 million which is recognized in the statement of profit or loss during the year.
The sale and leaseback facilitates transfer of residual value risk and also provides flexibility in managing the asset ageing and Group’s liquidity.
The carrying value of disposal group held for sale comprises of remaining telecom tower assets, remaining right of use of assets and its related lease liabilities classified as held for sale in Kuwait (2022 – Kuwait, KSA and Iraq) as follows.
9. Investments in associates and joint venture
+
9.1 Details of material associate
+
TASC
The Group’s hold 92.87% (31 December 2022 – 69.10%) interest in the equity shares of TASC Towers Holding Limited (”TASC”), a company incorporated in UAE.
During the year the Group increased its’ holding in TASC from 69.10% to 92.87% as a result of issuing of additional shares to settle the consideration on sale of TTI as disclosed in note 8.
The Group determines that it does not have the control over TASC on the basis that the Group does not have ability to have majority representation in the Board under the terms agreed in the agreement between TASC shareholders.
Summarised financial information in respect of TASC is set out below.
Reconciliation of the above summarised financial information to the carrying amount of the interest in TASC recognised in the consolidated financial statements:
In December 2023, the Group signed definitive agreements with Ooredoo Group Q.P.S.C (“Ooredoo”) for a merger transaction to combine both company’s passive infrastructures (towers) via a cash and share deal. The Group and Ooredoo will contribute assets and cash to the newly formed tower company to retain a 49.3% stake each in the newly formed tower company. The transaction (initial market closings) is expected to be completed by 2024.
9.2 Other associates
+
Investment in associate includes the Group’s :
- KD 1.055 million (31 December 2022 – KD 1.083 million) interest in IHS Kuwait Limited, a company incorporated in Kuwait, which represents 30% of the equity shares and voting rights of the associate. The associate became operational in February 2020 pursuant to the sale and lease back of telecommunication towers transaction with the Company.
- KD 0.554 million (31 December 2022 – KD Nil) interest in Entertainment Content Trading Company WLL (referred to as ”Playhera MENA”) , a company incorporated in Kingdom of Saudi Arabia, which represents 30% (31 December 2022 – Nil) of the equity shares of the associate acquired during 2023.
The carrying value of the associates and their results for the period are determined by Group management using the equity method based on management information provided by the associates.
9.3 Joint venture
+
Investment in joint venture includes Group’s KD 86.390 million (31 December 2022 – KD 81.925 million) interest in the joint venture, Zain Al Ajial S.A., a company incorporated in Morocco, that owns 31% of the equity shares and voting rights of Wana Corporate (a Moroccan joint stock company that is specialized in the telecom sector in that country). The carrying value of this joint venture and its results for the year are determined by Group management using the equity method based on management information provided by Wana Corporate.
10. Right of use of assets
+
The recognized right-of-use assets relate to the following types of assets:
31 December 2023
31 December 2022
Land and building comprises mainly of telecommunication sites on lease.
The Group does not have any lease contracts with variable lease payments which are not included in the measurement of the lease liabilities.
The Group’s leasing activities and how these are accounted for:
The Group mostly leases indoor and outdoor spaces for installation of its telecommunications sites. Rental contracts are typically made for fixed periods of 1 to 15 years. Lease terms are negotiated on an individual basis and contain a wide range of different terms and conditions. The lease agreements do not impose any covenants, but leased assets may not be used as security for borrowing purposes.
11. Property and equipment
+
Exchange adjustments in previous year include effect of hyperinflationary restatement of property and equipment in Zain South Sudan based on the respective price index changes.
Advances of KD 42.436 million (2022: KD 22.443 million) paid for projects in progress are included under Other noncurrent assets in the statement of financial position.
12. Intangible assets and goodwill
+
Goodwill has been allocated to the following Cash Generating Unit (CGU) which is expected to benefit from the synergies of the business combination. It is also the lowest level at which goodwill is monitored for impairment purposes. Goodwill and the CGU to which it has been allocated are as follows:
Impairment testing
The Group determines whether goodwill or intangible assets with indefinite useful lives are impaired, at least on an annual basis. This requires an estimation of the recoverable amount of the CGUs to which these items are allocated. The recoverable amount is determined based on value-in-use calculations or fair value less cost to sell if that is higher.
The Group determines the recoverable amounts of all CGUs based on value in use other than for SMTC. For SMTC the recoverable amount is determined based on the fair value less cost to sell. The fair value of Group’s holding in SMTC is determined with reference to the published quoted prices of SMTC.
Group management used the following approach to determine values to be assigned to the following key assumptions, in the value in use calculations:
The Group has performed a sensitivity analysis by varying these input factors by a reasonably possible margin and assessing whether the change in input factors results in any of the goodwill allocated to appropriate cash generating units being impaired.
These calculations use cash flow projections based on financial budgets approved by management covering a five year period. The recoverable amounts so obtained were higher than the carrying amount of the CGUs.
License and spectrum
Atheer
This includes the fee paid for the initial license in 2007, its renewal in 2020, 3G license in 2015 and for the 4G license in 2020.
Pella
In 2021, the Pella agreed to renew the new dynamic Telecom license from Telecom Regulatory Commission (“TRC”) for a period of 15 years at an amount of JD 156.375 million (KD 66.631 million) with payment terms being three equal instalments over a ten-year period without any interest charges.
In September 2022, JMTS a subsidiary of Pella, entered into a settlement agreement with TRC, to end all the disputes related to revenue sharing and to extend the useful lives of existing licenses, and grant of 5G license. Under this agreement all the existing spectrum licenses was extended for 10 years, in addition to another 5 years to be evaluated after 3 years based on specific criteria.
The Group allocated the total amount of the settlement agreement of JD 85.9 million between telecom license extensions, 5G license and to the dispute related to the revenue share based on the relative fair value. The amount allocated to the 5G, existing licenses and the dispute amounted to JD 26.9 million (KD 11.601 million), JD 36.1 million (KD 15.569 million) and JD 22.9 million (KD 9.876 million) respectively.
13. Trade and other payables
+
Dues to regulatory authorities include amount of SAR 805.367 million (KD 65.879 million) (2022: KD 79.708 million) payable by SMTC to Ministry of Finance and KD Nil (2022: 11.204 million) payable by Atheer to CMC for the renewal of existing license.
14. Income tax payables
+
Atheer – Iraq
Income tax assessment for 2011 is contested and is currently under the consideration of Iraq General Commission for Taxes (IGCT) (Note 29).
Atheer has booked the income tax expenses for the year from 2019 to date, based on self-assessment, considering most likely outcome. No assessment order has yet been received. Income tax assessment for all other years are paid and settled.
Management believes that they have adequate provisions for liabilities in respect of the assessments contested.
15. Due to banks
+
Reconciliation of movements of amounts due to banks to cash flows from financing activities:
The current and non-current amounts are as follows:
The carrying amounts of the Group’s borrowings are denominated in the following currencies:
The average effective interest rate as at 31 December 2023 was 6.52% (2022 – 4.06%) per annum.
The Group is compliant with the principal covenant ratios, which include:
- Consolidated net borrowings to adjusted consolidated Earnings Before Interest Tax Depreciation and Amortisation (EBITDA);
- Adjusted consolidated EBITDA to adjusted consolidated net interest payable;
- Consolidated net borrowings to consolidated net worth (equity);
Company
During the year, the Company has;
- Drawn down loans amounting to KD 150.607 million from existing and new facilities (31 December 2022 – KD 143.489 million). This includes:
– US$ 80 million (KD 24.536 million) of a revolving credit facility amounting to US$ 130 million.
– KD 101 million of a revolving credit facility amounting to KD 200 million.
– KD 15 million of a revolving credit facility amounting to KD 100 million. - Repaid loans amounting to KD 125.484 million (31 December 2022 – KD 127.457 million). This includes:
– US$ 70 million (KD 21.490 million) of a revolving credit facility amounting to US$ 130 million
– US$ 30.514 million (KD 9.350 million) of long-term facility amounting to US$ 194.117 million
– US$ 107.692 million (KD 32.997 million) of long-term facility amounting to US$ 200 million
– US$ 21.176 million (KD 6.488 million) of long-term facility amounting to US$ 87.705 million
– US$ 65 million (KD 19.971 million) of a term loan facility amounting to US$ 100 million
– US$ 30 million (KD 9.267 million) of a long-term facility amounting to US$ 317 million
The above facilities carry a fixed margin over three month CME term Secured Overnight Financing Rate (CME term SOFR) or over Central Bank Discount rate.
SMTC
Long-term loans include:
1. SAR 5,233 million (KD 428.059 million) (31 December 2022: SAR 5,488 million equivalent to KD 448.259 million) syndicated murabaha facility and SAR Nil (31 December 2022: SAR 520 million equivalent to KD 42.474 million) working capital facility availed from a consortium of banks.
In September 2020, SMTC signed an Amendment Agreement (the Agreement) with the consortium of lenders to refinance the Murabaha facilities that existed as of that date and to secure additional funding for future capital investment.
The Agreement:
- Includes a Total Term Murabaha Facility of SAR 6,000 million (KD 490.800 million), consisting of SAR 4.880 billion (KD 0.399 billion) and US$ portion of SAR 1.120 billion (KD 0.092 billion) for refinancing of the existing Term Murabaha Facility amounting to SAR 3.480 billion (KD 0.285 billion) and balance for future specified business purposes.
- Includes a revolving working capital facility of SAR 1,000 million (KD 81.800 million) consisting of SAR 813.393 million (KD 66.536 million) and a US$ portion totaling to SAR 186.607 million (KD 15.264 million).
The Murabaha Facility continues to be secured partially by a guarantee from the Company and a pledge of the Company’s and some of the founding shareholders’ shares in SMTC and assignment of certain contracts and receivables. Under the Murabaha Financing Agreement, SMTC can declare dividend or other distribution in cash or in kind to shareholders, provided SMTC is in compliance with all its obligations under the agreement.
A portion of above syndicated loan has been hedged through a profit rate swap contract.
Zain Jordan
Long term loans include:
- US$ 160 million (KD 49.152 million) (31 December 2022 – US$ 160 million equivalent to KD 48.928 million) term loan from a commercial bank which is repayable by 2025.
- US$ 100 million (KD 30.720 million) (31 December 2022 – US$ 100 million equivalent to KD 30.580 million) term loan from a commercial bank which is repayable by 30 April 2027.
Atheer
Long term loans include:
- US$ 50 million (KD 15.360 million) (31 December 2022 – US$ 70 million equivalent to KD 21.406 million) term loan from a commercial bank which is repayable by 17 December 2024.
- US$ 105 million (KD 32.256 million) (31 December 2022 – US$ 105 million equivalent to KD 32.109 million) term loan from a commercial bank which is repayable by 30 June 2026.
- US$ 125 million (KD 38.400 million) (31 December 2022 – US$ 150 million equivalent to KD 45.870 million) revolving credit facilities from a commercial bank which is repayable by 17 December 2025.
- US$ 100 million (KD 30.720 million) (31 December 2022 – US$ 100 million equivalent to KD 30.580 million) term loan from a commercial bank which is repayable by 30 July 2026.
- US$ 50 million (KD 15.360 million) (31 December 2022 – US$ 50 million equivalent to KD 15.290 million) term loan from a commercial bank which is repayable by 14 April 2024.
- US$ 48.750 million (KD 14.976 million) (31 December 2022 – US$ 63.750 million equivalent to KD 19.495 million) term loan from a commercial bank which is repayable by 28 April 2025.
- US$ 125 million (KD 38.400 million) (31 December 2022 – US$ 125 million equivalent to KD 38.225 million) term loan from a commercial bank which is repayable by 03 May 2025.
- US$ 100 million (KD 30.720 million) (31 December 2022 – US$ 100 million equivalent to KD 30.580 million) term loan from a commercial bank which is repayable by 25 May 2024.
These facilities are guaranteed by MTC and carry a floating interest rate of a fixed margin over three month SOFR.
16. Lease liabilities
+
Maturity analysis of lease liability is given in note 30 to the consolidated financial statements.
The weighted average lessee’s incremental borrowing rate applied to the lease liabilities was in the range of 3.8% to 21% (2022: 3.5% to 21%).
The carrying amounts of the lease liabilities are denominated in the following currencies:
17. Other non-current liabilities
+
During 2013, SMTC signed an agreement with the Ministry of Finance – KSA to defer payments that are due until 2021. The amounts are repayable in seven years starting from June 2021.
In February 2023, SMTC signed a revised agreement with the Ministry of Finance (“MOF”), Kingdom of Saudi Arabia under which the existing deferral of payment to MOF along with commercial commission payable was converted into a Murabaha facility with MOF and Al Rajhi Banking & Investment Corporation has been appointed as the Murabaha Facility Agent.
The current portion of these payables, including finance cost, SAR 657.328 million (KD 53.769 million) is recorded under trade and other payables.
18. Share capital and reserves
+
Share capital (par value of KD 0.100 per share)
Legal reserve
In accordance with the Companies Law and the Company’s Articles of Association, 10% of the profit for the year has to be appropriated towards legal reserve until such time it reaches a minimum of 50% of the share capital (the “threshold”). The Company has not made any transfers to legal reserve during the year as it has reached the threshold. This reserve can be utilized only for distribution of a maximum dividend of 5% in years when retained earnings are inadequate for this purpose.
Voluntary reserve
The Company’s Articles of Association provide for the Board of Directors to propose appropriations to voluntary reserve up to a maximum of 50% of its share capital. During the year, the Board of Directors did not propose any transfer (2022 – Nil).
Foreign currency translation reserve
Foreign currency translation reserve mainly represents foreign exchange translation losses arising from Zain Sudan and Zain South Sudan.
Other reserves
Other reserves mainly includes hedge reserves gain amounting to KD 2.795 million (2022- KD 3.857 million).
Dividend
Dividend – 2022
The annual general meeting of shareholders for the year ended 31 December 2022 held on 11 April 2023 approved distribution of a cash dividend of 25 fils per share to the registered shareholders, for the second half of the year 2022, after obtaining necessary regulatory approvals. This is in addition to the interim dividend of 10 fils distributed earlier in 2022 totaling 35 fils per share for the year 2022 (31 December 2021 – 33 fils per share).
Dividend 2023 – Proposed and interim
The Board of Directors recommends distribution of a cash dividend of 25 fils per share to the registered shareholders, for the second half of the year 2023, subject to shareholders and statutory approvals. This is in addition to the interim dividend of 10 fils distributed earlier in 2023 totaling 35 fils per share for the year 2023 as in the table above.
19. Revenue
+
19.1 Disaggregated revenue information
+
The total revenue disaggregated by major service lines is:
The total revenue disaggregated by primary geographical market and timing of revenue recognition is disclosed in note 26.
The Group has recognized the following contract assets and liabilities related to contract with customers;
19.2 Contract balances
+
Contract assets
Contract liabilities
As permitted under IFRS 15, the Group does not disclose transaction price allocated to the remaining performance obligations as it primarily provides services that correspond directly with the value transferred to the customer.
20. Operating and administrative expenses
+
- Operating and administrative expenses also includes staff costs of KD 166.181 million (2022 – KD 146.531 million).
- A part of the regulatory tariff levied on mobile telecommunication operators in Kuwait by the Ministry of Communication (MOC) since 26 July 2011 was invalidated by the Kuwait Court of Cassation in April 2017. Accordingly, the Group’s claim amounted to KD 24.680 million.
- In June 2022 and in February 2023 the Courts of First Instance and the Court of Appeal respectively, issued judgements in favor of the Group.
- In April 2023 MOC appealed to the Court of Cassation against the above ruling and to suspend its execution. The request to suspend the execution of order of Court of Appeal was rejected on 30 May 2023.
Based on the above, the Group received the above claim amounting to KD 24.680 million and has recognized an amount of KD 24.680 million in the consolidated statement of profit or loss and other comprehensive income for the year ended 31 December 2023.
21. Investment income
+
22. Finance cost
+
Finance cost consists of :
23. National Labour Support Tax (NLST) and Zakat
+
NLST and Zakat in Kuwait represents taxes payable to Kuwait’s Ministry of Finance under National Labour Support Law No. 19 of 2000 and Zakat Law No. 46 of 2006, respectively.
24. Income tax expenses
+
This represents the income tax and other tax expenses of subsidiaries.
The tax rate applicable to the taxable subsidiary companies is in the range of 7% to 26% (2022: 7% to 26%) whereas the effective income tax rate for the year ended 31 December 2023 is in the range of 4% to 24% (2022: 4% to 24%). For the purpose of determining the taxable results for the year, the accounting profits were adjusted for tax purposes. The adjustments are based on the current understanding of the existing laws, regulations and practices of each overseas subsidiary companies’ jurisdiction.
Pillar 2 Income Taxes
In 2021, the OECD’s Inclusive Framework (IF) on Base Erosion and Profit Shifting (BEPS) reached an agreement on a two-pillar approach to tackle tax challenges arising from the digitalization of the economy. Under Pillar 2, Multinational Entities (MNEs) with revenues exceeding EUR 750 million are liable to pay a minimum effective corporate income tax rate of 15% in each jurisdiction where they operate.
Zain Group operates in multiple jurisdictions that have joined the IF. The Global Minimum Tax under Pillar 2 is applicable for all jurisdictions effective 2025 except Zain Sudan (held via ZIBV in the Netherlands), where this Global Minimum Tax is applicable effective 2024.
Currently, the Group is assessing its exposure to additional income taxes under Pillar 2 regulations. The assessment suggests that a portion of the Group’s earnings will be subject to these additional taxes. However, providing a reasonable estimate of the additional tax burden is challenging at this stage, as the relevant tax legislation has yet to be introduced in Kuwait and some other jurisdictions.
25. Earnings per share
+
Basic and diluted earnings per share based on weighted average number of shares outstanding during the year are as follows:
26. Segment information
+
The Company and its subsidiaries operate in a single business segment, telecommunications and related services. Apart from its operations in Kuwait, the Company also operates through its foreign subsidiaries in Jordan, Sudan, Iraq, Bahrain, KSA, Lebanon and South Sudan. This forms the basis of the geographical segments.
Based on the disclosure criterion, the Group has identified its telecommunications operations in Kuwait, Jordan, Sudan, Iraq, Bahrain and KSA as the basis for disclosing the segment information.
27. Subsidiaries with significant non-controlling interests
+
The summarized financial information for the Group’s subsidiaries that have significant non-controlling interests is set out below.
28. Related party transactions
+
The Group has entered into transactions with related parties on terms approved by management. Transactions and balances with related parties (in addition to those disclosed in other notes) are as follows:
The group has entered into transactions with Kuwait government in the ordinary course of business.
29. Commitments and contingencies
+
Atheer – Iraq
Atheer received an additional income tax claim of US$ 19.3 million (KD 5.902 million) from IGCT for the year 2011 on 9 March 2020. On 12 March 2020, Atheer submitted its objection to this additional income tax claim which was rejected by the IGCT on 15 March 2020. This additional tax claim is now under appeal procedures before the Appeals Committee of IGCT. Atheer believes that it has adequate provisions to meet this liability, if it arises.
On 10 September 2023, the Communication and Media Commission of Iraq (“CMC”) imposed a fine of US$ 75 million (KD 23.018 million) on Atheer for failing to meet 4G QoS (‘Quality of Service’) KPIs for the year 2022. Atheer’s position is that the penalties are not assessed in line with license agreement with CMC and did not comply with existing regulations. On 9 October 2023, Atheer challenged the decision before the Appeals Board. Based on the report from its attorneys, Atheer believes that the prospects of this matter being re-solved in Atheer’s favor are good.
Pella – Jordan
Pella is a defendant in lawsuits amounting to KD 22.613 million (31 December 2022 – KD 22.573 million). Based on the report of its attorneys, the Group expects the outcome of these proceedings to be favorable to Pella.
SMTC
SMTC received withholding tax assessments from Zakat, Tax and Customs Authority (“ZATCA”) for an additional amount of SAR 252 million (KD 20.614 million) for certain withholding tax items for the years from 2012 to 2013 and from 2015 to 2021. SMTC has appealed these assessments against the relevant committees. The SMTC believes that the outcome of those appeals will be in its favor with no material financial impact as SMTC has sufficient provisions to cover these amounts.
In addition, legal proceedings have been initiated by and against the Group in some jurisdictions. On the basis of information currently available and the advice of the legal advisors, Group management is of the opinion that the outcome of these proceedings is unlikely to have a material adverse effect on the consolidated financial position or the consolidated performance of the Group.
30. Financial risk management
+
The Group’s financial assets have been categorized as follows:
Financial risk factors
The Group’s use of financial instruments exposes it to a variety of financial risks such as market risk, credit risk and liquidity risk. The Group continuously reviews its risk exposures and takes measures to limit it to acceptable levels. The Board of Directors has the overall responsibility for the establishment and oversight of the Group’s risk management framework and developing and monitoring the risk management policies in close co-operation with the Group’s operating units. The Group’s risk management policies are established to identify and analyse the risks faced by the Group, to set appropriate risk limits and controls, and to monitor risks and adherence to limits. Risk management policies and systems are reviewed regularly to reflect changes in market conditions and Group’s activities. The Group through its training, management standards and procedures aims to develop a disciplined and constructive control environment in which all employees understand their roles and obligations. The Group’s Board Committee oversees how management monitors compliance with the risk management policies and procedures and reviews adequacy of the risk management framework in relation to the risks faced by the Group. The Board Committee is assisted in its oversight role by the Internal audit and the Group risk management department. The significant risks that the Group is exposed to are discussed below:
(a) Market risk
(i) Foreign exchange risk
Foreign currency risk is the risk that the fair values or future cash flows of a financial instrument will fluctuate due to changes in foreign exchange rates. The Group is exposed to foreign exchange risk arising from various currency exposures, primarily with respect to the US Dollar. Foreign exchange risk arises from future commercial transactions, recognised assets, recognised liabilities and net investments in foreign operations.
Group management has set up a policy that requires Group companies to manage their foreign exchange risk against their functional currency. Foreign exchange risk arises when future commercial transactions or recognised assets or liabilities are denominated in a currency that is not the entity’s functional currency.
The Group is primarily exposed to foreign currency risk as a result of foreign exchange gains/losses on translation of foreign currency denominated assets and liabilities such as trade and other receivables, trade and other payables and due to banks. The impact on the post tax consolidated profit arising from a 10% weakening/ strengthening of the functional currency against the major currencies to which the Group is exposed is given below:
(ii) Equity price risk
This is the risk that the value of financial instruments will fluctuate as a result of changes in market prices, whether these changes are caused by factors specific to individual instrument or its issuer or factors affecting all instruments, traded in the market. The Group is exposed to equity securities price risk because of investments held by the Group and classified in the consolidated statement of financial position as FVOCI and FVTPL. The Group is not exposed to commodity price risk. To manage its price risk arising from investments in equity securities, the Group diversifies its portfolio. Diversification of the portfolio is done in accordance with the limits set by the Group.
The effect on the consolidated profit as a result of changes in fair value of equity instruments classified as ‘at fair value through profit or loss’ and the effect on equity of equity instruments classified as ‘fair value through other comprehensive income’ arising from a 5% increase/ decrease in equity market index, with all other variables held constant is as follows:
(iii) Cash flow and fair value interest rate risk
Interest rate risk is the risk that the fair value or future cash flows of a financial instrument will fluctuate because of changes in market interest rates.
The Group’s interest rate risk arises from short-term bank deposits and bank borrowings carried at amortized cost. Borrowings issued at variable rates expose the Group to cash flow interest rate risk. The Group’s borrowings at variable rates are denominated mainly in US Dollars.
The Group analyses its interest rate exposure on a dynamic basis. Various scenarios are simulated taking into consideration refinancing, renewal of existing positions and alternative financing. Based on these scenarios, the Group calculates the impact on consolidated statement of profit or loss of a defined interest rate shift. For each simulation, the same interest rate shift is used for all currencies. The scenarios are run only for liabilities that represent the major interest-bearing positions. The Group manages interest rate risk by monitoring interest rate movements and by using Interest Rate Swaps to hedge interest rate risk exposures. Hedging activities are evaluated regularly to align with interest rate views and defined risk appetite, ensuring the most cost-effective hedging strategies are applied.
At 31 December 2023, if interest rates at that date had been 50 basis points higher/lower with all other variables held constant, consolidated profit for the year would have been lower/higher by KD 5.806 million (2022: KD 6.551 million).
b) Credit risk
Credit risk is the risk that one party to a financial instrument will fail to discharge an obligation causing the other party to incur a financial loss. Financial assets, which potentially subject the Group to credit risk, consist principally of fixed and short notice bank deposits, trade and other receivables, contract assets and due from associates.
The Group manages the credit risk on bank balances by placing fixed and short term bank deposits with high credit rating financial institutions. Credit risk with respect to trade receivables and contract assets is limited due to dispersion across large number of customers. Group manages credit risk of customers by continuously monitoring and using experienced collection agencies to recover past due outstanding amounts. Credit risk of distributors, roaming and interconnect operators, due from associates and others including third parties on whose behalf financial guarantees are issued by the Group is managed by periodic evaluation of their credit worthiness or obtaining bank guarantees in certain cases.
Expected credit loss (ECL) measurement
IFRS 9 outlines a ‘three-stage’ model for impairment based on changes in credit quality since initial recognition wherein if a financial instrument that is not credit-impaired on initial recognition is classified in Stage 1. If a significant increase in credit risk (‘SICR’) since initial recognition is identified, the financial instrument is moved to Stage 2 but is not yet deemed to be credit-impaired and if the financial instrument is credit-impaired, the financial instrument is then moved to Stage 3.
Significant increase in credit risk
When determining whether the risk of default has increased significantly since initial recognition, the Group considers quantitative, qualitative information and backstop indicators and analysis based on the Group’s historical experience and expert credit risk assessment, including forward-looking information. For customer, distributors, roaming and interconnect trade receivables significant increase in credit risk criteria does not apply since the group is using simplified approach which requires use of lifetime expected loss provision.
For amounts due from banks, the Group uses the low credit risk exemption as permitted by IFRS 9 based on the external rating agency credit grades. If the financial instrument is rated below BBB- (sub investment grade) on the reporting date, the Group considers it as significant increase in credit risk.
Financial instrument is determined to have low credit risk if:
- The financial instrument has a low risk of default,
- The debtor has a strong capacity to meet its contractual cash flow obligations in the near term, and
- Adverse changes in economic and business conditions in the longer term may, but will not necessarily, reduce the ability of the borrower to fulfil its contractual cash flow obligations.
The Group considers a financial asset to have low credit risk when the asset has external credit rating of ‘investment grade’ in accordance with the globally understood definition or if an external rating is not available, the asset has an internal rating of ‘performing’. Performing means that the counterparty has a strong financial position and there is no past due amounts.
Credit impaired assets
The Group considers a financial asset to be in default when the borrower is unlikely to pay its credit obligations to the Group in full, there is sufficient doubt about the ultimate collectability; or the customer is past due for more than 90 days.
Incorporation of forward looking information
The Group incorporates forward-looking information into both its assessment of whether the credit risk of an instrument has increased significantly since its initial recognition and its measurement of ECL. The Group has performed historical analysis and identified Gross Domestic Product (GDP) of each geography in which they operate as the key economic variables impacting credit risk and ECL for each portfolio. Relevant macro-economic adjustments are applied to capture variations from economic scenarios. These reflect reasonable and supportable forecasts of future macro-economic conditions that are not captured within the base ECL calculations. Incorporating forwardlooking information increases the degree of judgement required as to how changes in GDP will affect ECLs. The methodologies and assumptions including any forecasts of future economic conditions are reviewed regularly.
The following table contains an analysis of the maximum credit risk exposure of financial instruments for which an ECL allowance is recognized:
ECL allowance of trade and other receivables are assessed as follows:
The following table shows the movement in the loss allowance that has been recognized for trade and other receivables and contract assets:
For customer, distributor and contract assets the Group uses a provision matrix based on the historic default rates observed and adjusted for forward looking factors to measure ECL as given below.
Credit quality of roaming, interconnect and other balances:
The net increase in the loss allowance during the year is mainly attributed to the increase in gross exposures at default, which are past due for more than 90 days.
The Group writes off a trade receivable when there is information indicating that the debtor is in severe financial difficulty and there is no realistic prospect of recovery.
(c) Liquidity risk
Liquidity risk is the risk that the Group may not be able to meet its funding requirements. The Group manages this risk by maintaining sufficient cash and marketable securities, availability of funding from committed credit facilities and its ability to close out market positions on short notice. The Company’s Board of Directors increases capital or borrowings based on ongoing review of funding requirements.
The Group has committed to provide working capital and other financial support to some of its affiliates (refer note 3). Other than the total cash and bank balances of KD 62.067 million (2022 – KD 50.757 million) equivalent held in Sudan, South Sudan and Lebanon, all other cash and bank balances are maintained in freely convertible currencies.
The table below analyses the Group’s financial liabilities into relevant maturity groupings based on the remaining period at the consolidated statement of financial position to the contractual maturity date. The amounts disclosed in the table are the contractual undiscounted cash flows. Balances due within 12 months equal their carrying balances, as the impact of discounting is not significant.
31. Derivative financial instruments
+
In the ordinary course of business, the Group uses derivative financial instruments to manage its exposure to fluctuations in interest and foreign exchange rates. A derivative financial instrument is a financial contract between two parties where payments are dependent upon movements in price of one or more underlying financial instruments, reference rate or index.
The table below shows the positive and negative fair values of derivative financial instruments, together with the notional amounts analysed by the term to maturity. The notional amount is the amount of a derivative’s underlying asset, reference rate or index and is the basis upon which changes in the value of derivatives are measured.
The notional amounts indicate the volume of transactions outstanding at the year end and are not indicative of either market or credit risk. All derivative contracts are fair valued based on observable market data.
Profit rate swaps are contractual agreements between two parties to exchange interest based on notional value in a single currency for a fixed period of time. The Group uses profit rate swaps to hedge changes in interest rate risk arising from floating rate borrowings.
32. Capital risk management
+
The Group’s objectives when managing capital are to safeguard the Group’s ability to continue as a going concern in order to provide return on investment to shareholders and benefits for other stakeholders and to maintain an optimal capital structure to reduce the cost of capital. In managing capital, the Group considers the financial covenants in various loan agreements that require the Group to maintain specific levels of debt-equity and leverage ratios.
In order to maintain or adjust the capital structure, the Group may adjust the amount of dividends paid to shareholders, return capital to shareholders, issue new shares or sell assets to reduce debt.
Consistent with others in the industry, the Group monitors capital on the basis of the gearing ratio. This ratio is calculated as net debt divided by total capital. Net debt is calculated as total borrowings less cash and cash equivalents. Total capital is calculated as equity, as shown in the consolidated statement of financial position, plus net debt.
The gearing ratios at the consolidated statement of financial position dates were as follows:
33. Fair value of financial instruments
+
The fair value hierarchy of the Group’s financial instruments is as follows.
Fair values of the financial instruments carried at amortized cost approximate their carrying value. This is based on level 3 inputs, with the discount rate that reflects the credit risk of counterparties, being the most significant input. During the year, there were no transfers between any of the fair value hierarchy levels.
34. Net monetary gain – South Sudan
+
The Republic of South Sudan economy had become hyperinflationary in 2016. Accordingly, the results, cash flows and financial position of the Group’s subsidiary in South Sudan have been expressed in terms of the measuring unit current at the reporting date in accordance with IAS 29 upto 31 December 2022. The impact of Net monetary gain/ loss for the year ended 31 December 2023 is not material to the consolidated financial statements.
35. Significant accounting judgments and estimates
+
In accordance with the accounting policies contained in IFRS and adopted by the Group, management makes the following judgments and estimations that may significantly affect amounts reported in these consolidated financial statements.
Judgments
Business combinations
To allocate the cost of a business combination management exercises significant judgment to determine identifiable assets, liabilities and contingent liabilities whose fair value can be reliably measured, to determine provisional values on initial accounting and final values of a business combination and to determine the amount of goodwill and the Cash Generating Unit to which it should be allocated.
Consolidation of entities in which the Group holds less than a majority of voting right (de facto control)
The Group considers that it controls SMTC though it owns less than 50% of the voting rights. In assessing whether the Group has de-facto control, the management exercised significant judgment which takes into account many factors such as it being the single largest shareholder in SMTC, its majority representation in the Board, voting patterns of other dominant shareholders etc. If the Group had concluded that the ownership interest was insufficient to give the Group control in SMTC, it would instead have been classified as an associate and the Group would have accounted for it using the equity method of accounting.
Identifying performance obligations in a bundled sale of equipment and installation services
The Group provides telecommunications services that are either sold separately or bundled together with the sale of equipment (hand sets) to a customer. The Group uses judgement in determining whether equipment and services are capable of being distinct. The fact that the Group regularly sells both equipment and services on a stand-alone basis indicates that the customer can benefit from both products on their own. Consequently, the Group allocated a portion of the transaction price to the equipment and the services based on relative stand-alone selling prices.
Principal versus agent considerations
Revenue from value added services (VAS) sharing arrangements depend on the analysis of the facts and circumstances surrounding these transactions. The determination of whether the Group is acting as an agent or principal in these transactions require significant judgement and depends on the following factors:
- The Group is primarily responsible for fulfilling the promise to provide the service.
- Whether the Group has inventory risk
- Whether the Group has discretion in establishing the price
Consideration of significant financing component in a contract
The Group sells bundled services on a monthly payment scheme over a period of one to two years.
In concluding whether there is a significant financing component in a contract requires significant judgements and is dependent on the length of time between the customers payment and the transfer of equipment to the customer, as well as the prevailing interest rates in the market. The Group has concluded that there is no significant financing component in its contract with customers after such assessment.
In determining the interest to be applied to the amount of consideration, the Group has concluded that the interest rate implicit in the contract (i.e., the interest rate that discounts the cash selling price of the equipment to the amount paid in advance) is appropriate because this is commensurate with the rate that would be reflected in a separate financing transaction between the entity and its customer at contract inception.
Assets held for sale
The Group has announced its decision to sell some of the telecom tower assets in Kuwait. Part of these telecom towers were sold during the year and the remaining towers are recorded under “assets and liabilities of disposal group classified as held for sale”. This is considered to have met the criteria as held for sale for the following reasons:
- These assets are available for immediate sale and can be sold to the buyer in its current condition
- The actions to complete the sale were initiated and expected to be completed within one year from the date of initial classification
- A potential buyer has been identified and negotiations as at the reporting date are at an advance stage
These assets continued to be classified as non-current assets held for sale as the Group is committed to its plan to sell the assets and the delay was caused due to events and circumstances beyond the Group’s control.
Classification of equity investments
On acquisition of an equity investment security, the Group decides whether it should be classified as fair value through profit or loss or fair value through other comprehensive income.
Contingent liabilities
Contingent liabilities are potential liabilities that arise from past events whose existence will be confirmed only by the occurrence or non-occurrence of one or more uncertain future events not wholly within the control of the entity. Provisions for liabilities are recorded when a loss is considered probable and can be reasonably estimated. The determination of whether or not a provision should be recorded for any potential liabilities or litigation is based on management’s judgment.
Hyperinflation
The Group exercises significant judgement in determining the onset of hyperinflation in countries in which it operates and whether the functional currency of its subsidiaries, associates or joint venture is the currency of a hyperinflationary economy.
Various characteristics of the economic environment of each country are taken into account. These characteristics include, but are not limited to, whether:
- the general population prefers to keep its wealth in non-monetary assets or in a relatively stable foreign currency;
- prices are quoted in a relatively stable foreign currency;
- sales or purchase prices take expected losses of purchasing power during a short credit period into account;
- interest rates, wages and prices are linked to a price index; and
- the cumulative inflation rate over three years is approaching, or exceeds, 100%.
Management exercises judgement as to when a restatement of the financial statements of a Group entity becomes necessary.
Determining the lease term
In determining the lease term, management considers all facts and circumstances that create an economic incentive to exercise an extension option, or not exercise a termination option. Extension and termination options are included in a number of leases across the Group. These terms are used to maximise operational flexibility in terms of managing contracts. Extension options (or periods after termination options) are only included in the lease term if the lessee is reasonably certain to extend (or not to terminate) the lease. The assessment is reviewed if a significant event or a significant change in circumstances occurs which affects this assessment and that is within the control of the lessee.
Discounting of lease payments
The lease payments are discounted using the Company’s incremental borrowing rate (“IBR”). Management has applied judgments and estimates to determine the IBR at the commencement of lease.
Determination of functional currency
The devaluation of the Iraqi Dinar (IQD) against the USD in December 2020 resulted in a reconsideration of the functional currency of Atheer. Prior to 2020 the financial statements indicated that the functional currency was IQD however, since the IQD was pegged to the USD there was no material impact on the reported figures whichever currency had been identified as the functional currency. In consideration of the primary indicators in IAS 21: 9, following the devaluation in December 2020 the Company has immediately decided on an increase in tariffs to customers and has implemented those increases in order to follow its long term strategy to maintain a relatively consistent USD margin which is driven by its predominantly USD cost base. This provides a strong evidence that USD is the currency that mainly influences sales prices for goods and services and USD is also the currency of the country whose competitive forces and regulations mainly determine the sales prices of its goods and services. Furthermore, in consideration of the secondary indicators in IAS 21:10, the majority of the Company’s financing is generated in USD and the majority of the Company’s funds from operating activities are retained in USD. Therefore, in accordance with IAS 21:12, the Company determined that, in its judgement, all the factors described above provide sufficient evidence that the USD is the functional currency that most faithfully reflect the underlying transactions, events and conditions relevant to the Company.
Sources of estimation uncertainty
Fair values – unquoted equity investments and business combinations
The valuation techniques for unquoted equity investments and identifiable assets, liabilities and contingent liabilities arising in a business combination make use of estimates such as future cash flows, discount factors, yield curves, current market prices adjusted for market, credit and model risks and related costs and other valuation techniques commonly used by market participants where appropriate.
Provision for expected credit losses of customer, distributor receivables and contract assets
The Group uses a provision matrix to calculate ECLs for customer, distributor receivables and contract assets. The provision rates are based on days past due for groupings of various customer segments that have similar loss patterns. The provision matrix is initially based on the Group’s historical observed default rates. The Group will calibrate the matrix to adjust the historical credit loss experience with forward-looking information. For instance, if forecast economic conditions (i.e., gross domestic product) are expected to deteriorate over the next year, which can lead to an increased number of defaults the historical default rates are adjusted. At every reporting date, the historical observed default rates are updated and changes in the forward-looking estimates are analysed.
The assessment of the correlation between historical observed default rates, forecast economic conditions and ECLs is a significant estimate. The amount of ECLs is sensitive to changes in circumstances and of forecast economic conditions. The Group’s historical credit loss experience and forecast of economic conditions may also not be representative of customer’s actual default in the future. The information about the ECLs on the Group’s trade receivables and contract assets is disclosed in note 30.
Tangible and intangible assets
The Group estimates useful lives and residual values of tangible assets and intangible assets with definite useful lives. Changes in technology or intended period of use of these assets as well as changes in business prospects or economic industry factors may cause the estimate useful of life of these assets to change.
Taxes
The Group is subject to income taxes in numerous jurisdictions. Significant judgment is required in determining the provision for income taxes. There are many transactions and calculations for which the ultimate tax determination is uncertain during the ordinary course of business. The Group recognizes a liability for anticipated taxes based on estimates of whether additional taxes will be due. Where the final tax outcome of these matters is different from the amounts that were initially recorded, such differences will impact the income tax and deferred tax provisions in the period in which such determination is made. Any changes in the estimates and assumptions used as well as the use of different, but equally reasonable estimates and assumptions may have an impact on the carrying values of the deferred tax assets.
Impairment of non-financial assets
The Group annually tests non-financial assets for impairment to determine their recoverable amounts based on valuein-use calculations or at fair value less costs to sell. The value in use includes estimates on growth rates of future cash flows, number of years used in the cash flow model and the discount rates. The fair value less cost to sell estimate is based on recent/intended market transactions and the related EBITDA multiples used in such transactions.
36. Subsequent event
+
The Government of Iraq passed a resolution in April 2023 that all monetary transactions within the country will be denominated and settled in Iraqi Dinar, with no effective date of implementation. The Central Bank of Iraq announced in October 2023 banning all cash withdrawals and transactions in US Dollars with effect from 1 January 2024. Accordingly, Atheer has started the process of revising its contracts with suppliers in line with this change and believes that the functional currency of Atheer has changed from US Dollar to Iraqi Dinar with effect from 1 January 2024. This is because the currency of the primary economic environment in which Atheer operates has changed from US Dollar to Iraqi Dinar. Therefore, from 1 January 2024 onwards, the functional currency of Atheer is Iraqi Dinar. In accordance with IAS 21 this change has been accounted for prospectively from this date.